
Bearish Counterattack Candlestick Pattern
If you’re a trader who uses candlestick charts to analyze market trends, you may have come across the bearish counterattack candlestick pattern. This pattern is a reversal signal that can help you identify when a bullish trend is about to turn bearish. In this blog post, we’ll explore what the bearish counterattack pattern is, its key features, how to trade it, and how to identify it.
What Is Bearish Counterattack Candlestick Pattern?
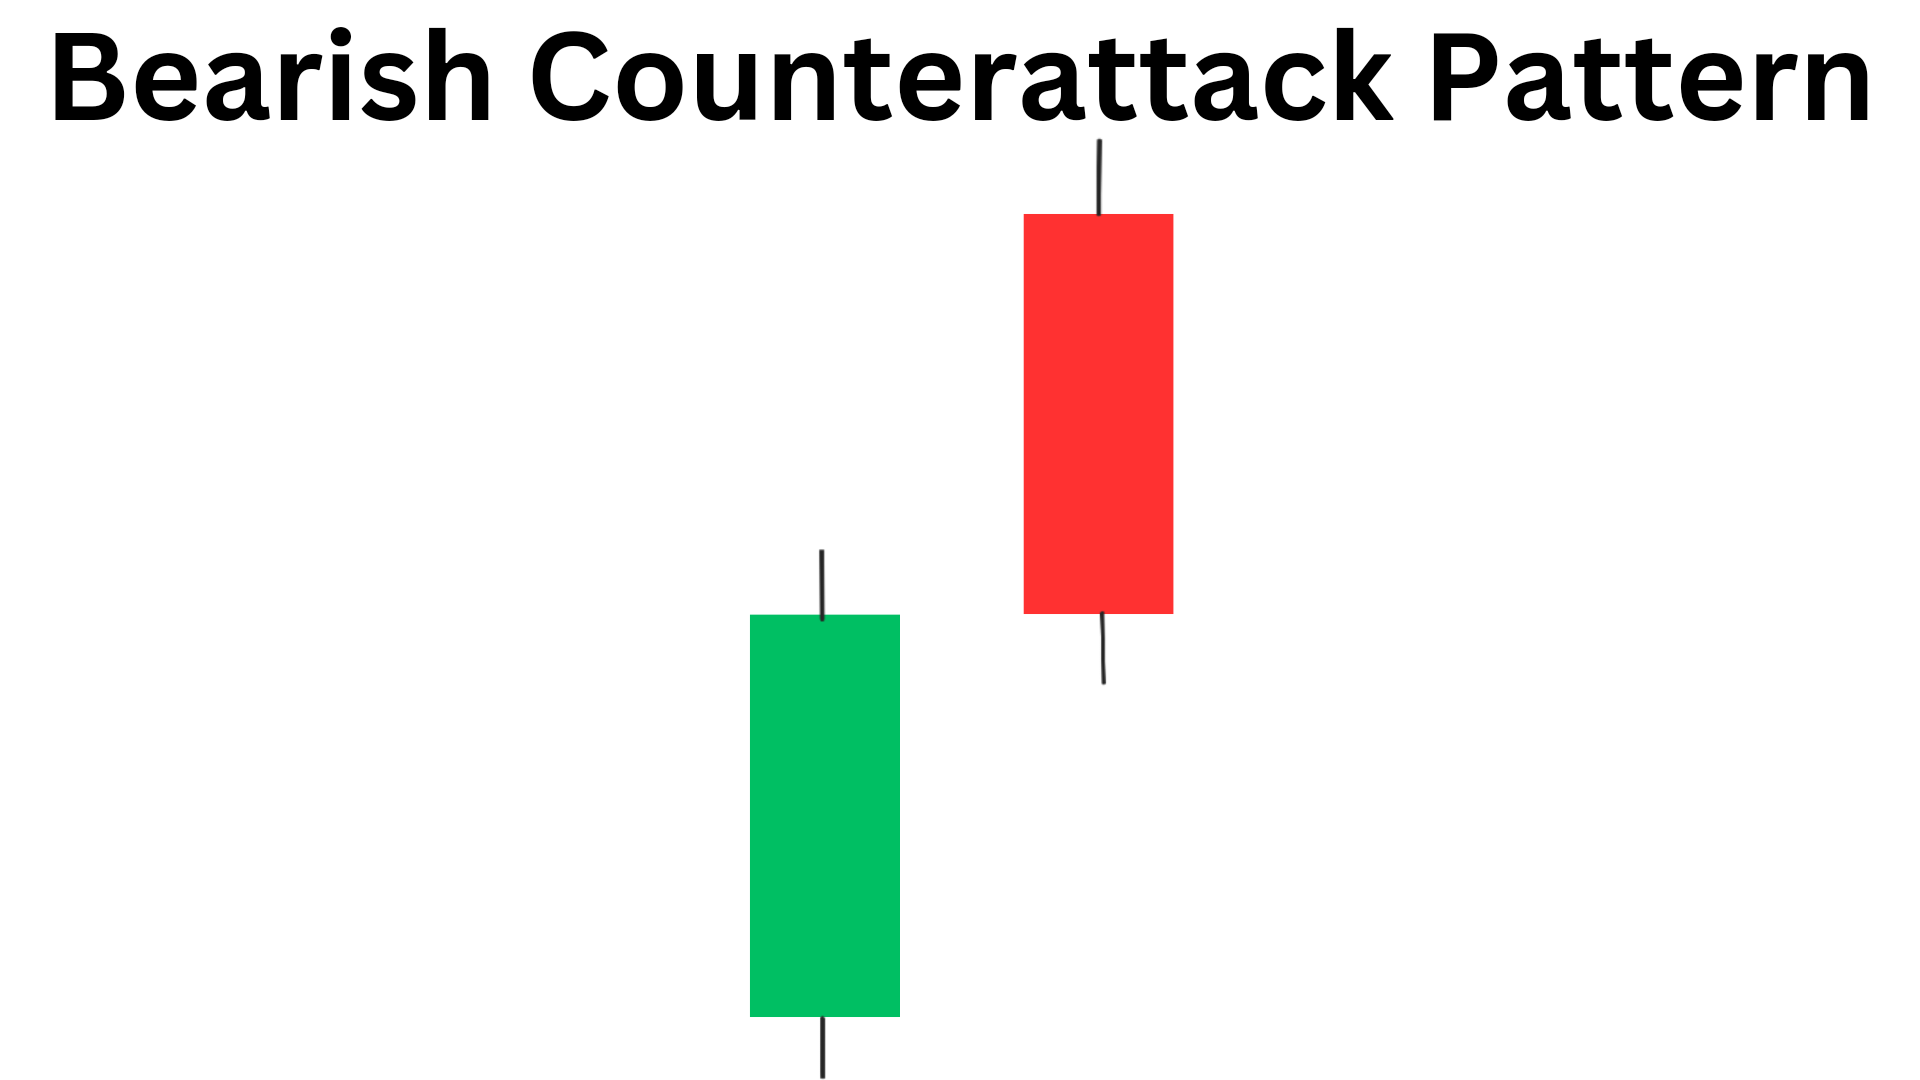
The bearish counterattack pattern is a two candlestick bearish reversal pattern that is formed at the end of an uptrend. The first candlestick is a bullish candlestick, which means the price of the asset has gone up during that period. The second candlestick is a bearish candlestick that opens above the high of the first candlestick but closes below its midpoint. This indicates that the bears have taken control of the market and are pushing prices down.
Key Features of Bearish Counterattack Candlestick Pattern
There are several key features of the bearish counterattack candlestick pattern that you should be aware of:
1. The pattern consists of two candlesticks, with the first one being bullish and the second one being bearish.
2. The second candlestick opens above the high of the first candlestick but closes below its midpoint.
3. The pattern occurs during an uptrend and signals a potential reversal.
4. The bearish counterattack pattern is a strong reversal signal when it occurs after a long uptrend.
Top Bestseller mastermind book to learn trading from scratch along with examples click here.
How to Identify Bearish Counterattack Candlestick Pattern?
To identify a bearish counterattack pattern, you need to look for two candlesticks that meet the criteria we’ve discussed. The first candlestick should be bullish, and the second candlestick should open above the high of the first candlestick but close below its midpoint.
You can use technical analysis tools like chart patterns and indicators to help you identify bearish counterattack patterns. For example, you can use the Relative Strength Index (RSI) to identify overbought conditions in an uptrend, which can increase the likelihood of a bearish reversal.
How to Trade Bearish Counterattack pattern?
When you see a bearish counterattack candlestick pattern, it’s a good idea to consider taking a short position in the asset. This means you’ll be betting that the price of the asset will go down. You can enter your trade once the second candlestick has closed below the midpoint of the first candlestick.

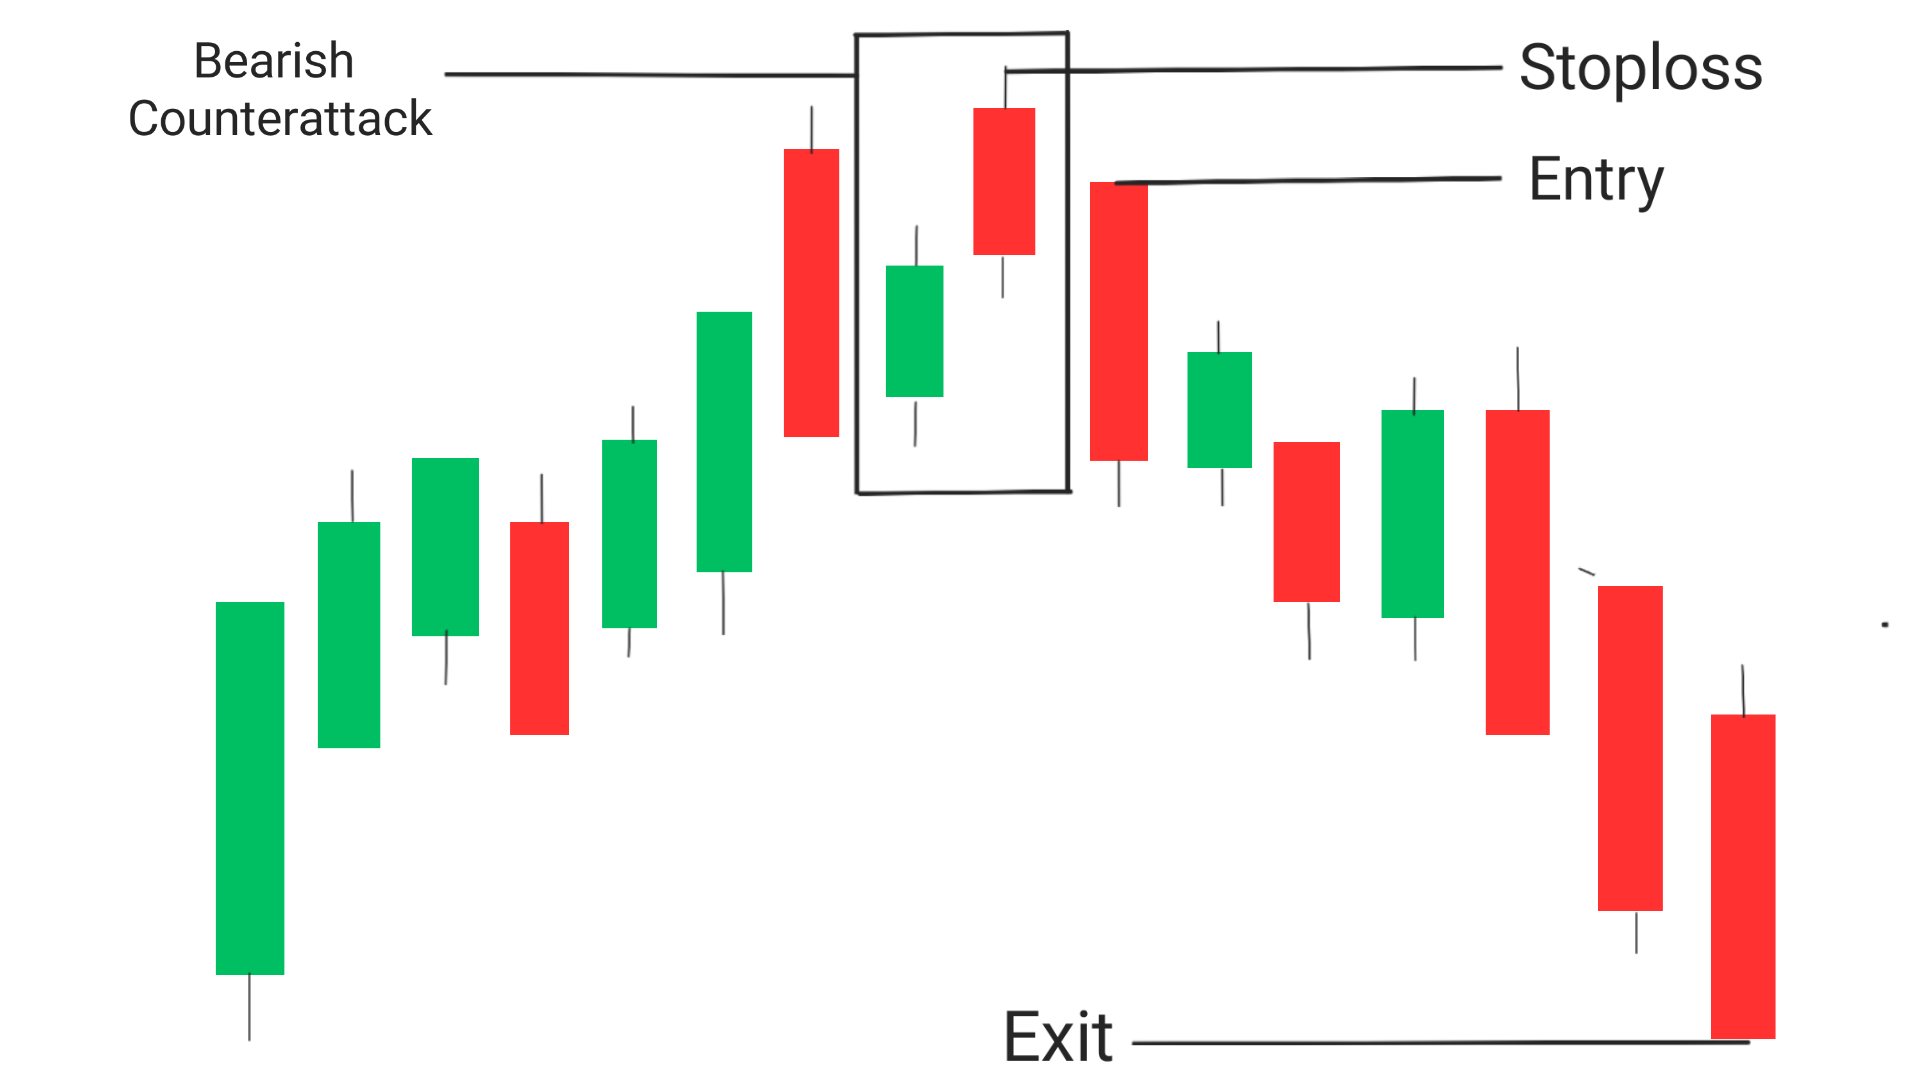
Entry: The best possible enty point is the candle which closes below the low of the bearish counterattack candlestick pattern.
Exit: Exit the trade when it reaches a significantsupport level, if you wnat to trade more you can look for a breakout near resistance level, if it happens then you can trade upto a new support level.
Stoploss: In order to reduce the risk of stoploss hitting you can set sthe high of the pattern as the stoploss.
To manage your risk, you should place a stop-loss order above the high of the first candlestick. This will help you limit your losses if the price of the asset continues to rise.
Conclusion
The bearish counterattack candlestick pattern is a powerful reversal signal that can help you identify when an uptrend is about to turn bearish. By understanding its key features and how to trade it, you can use this pattern to improve your trading strategy and increase your profitability. Remember to always manage your risk by using stop-loss orders and other risk management techniques. Happy trading!
Frequently Asked Questions
1.What is bearish counterattack?
Bearish counterattack is a two-candlestick bearish reversal pattern that occurs during an uptrend and signals a potential reversal. The first candlestick is bullish, and the second one is bearish, opening above the high of the first candlestick but closing below its midpoint.
2.What is an example of a bearish reversal?
An example of a bearish reversal is when a stock or asset has been in an uptrend for a while, and then suddenly starts to decline in price, indicating a shift in market sentiment from bullish to bearish
3.What is the 3 candle rule in trading?
The 3 candle rule in trading refers to waiting for three consecutive candlesticks to confirm a trend before making a trade. For example, if you see three bearish candlesticks in a row, it may indicate a downtrend and prompt you to take a short position.
4.How does Counterattack work?
The bearish counterattack pattern works by signaling that the bears have taken control of the market and are pushing prices down. Traders can use this pattern to take short positions and profit from the expected price decline.
5.What is bearish kicking pattern?
The bearish kicking pattern is a two-candlestick pattern that occurs during an uptrend. The first candlestick is bullish, and the second one is bearish, opening below the low of the first candlestick and closing below its own opening price. This pattern is a strong reversal signal and indicates that the bears have taken control of the market.
