
Mastering the Channel Down Chart Pattern: 5 FAQs
In the world of technical analysis, chart patterns play a crucial role in helping traders predict future price movements. One such pattern that traders often rely on is the channel down chart pattern. Understanding this pattern can provide valuable insights into potential market trends and help traders make informed decisions. In this blog post, we will explore the channel down chart pattern in detail and discuss how traders can use it to their advantage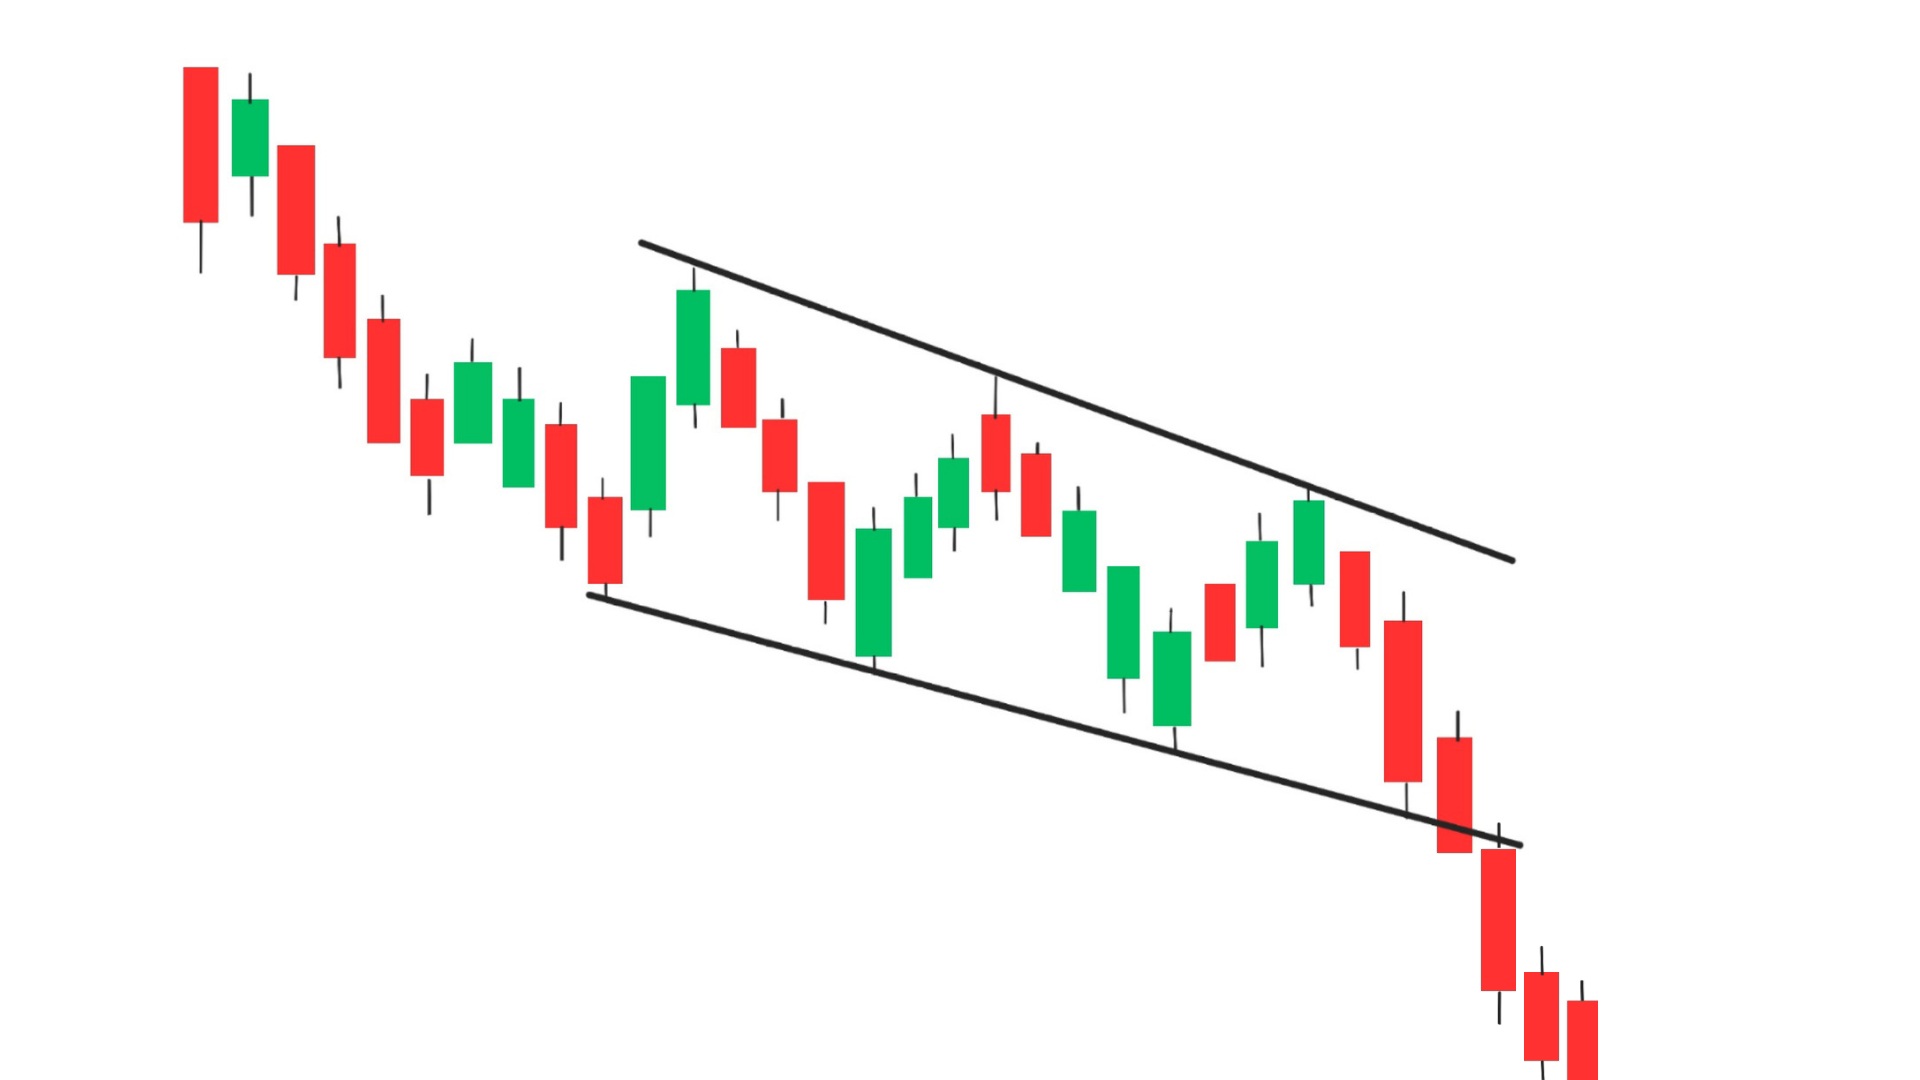
What is the Channel Down Chart Pattern?
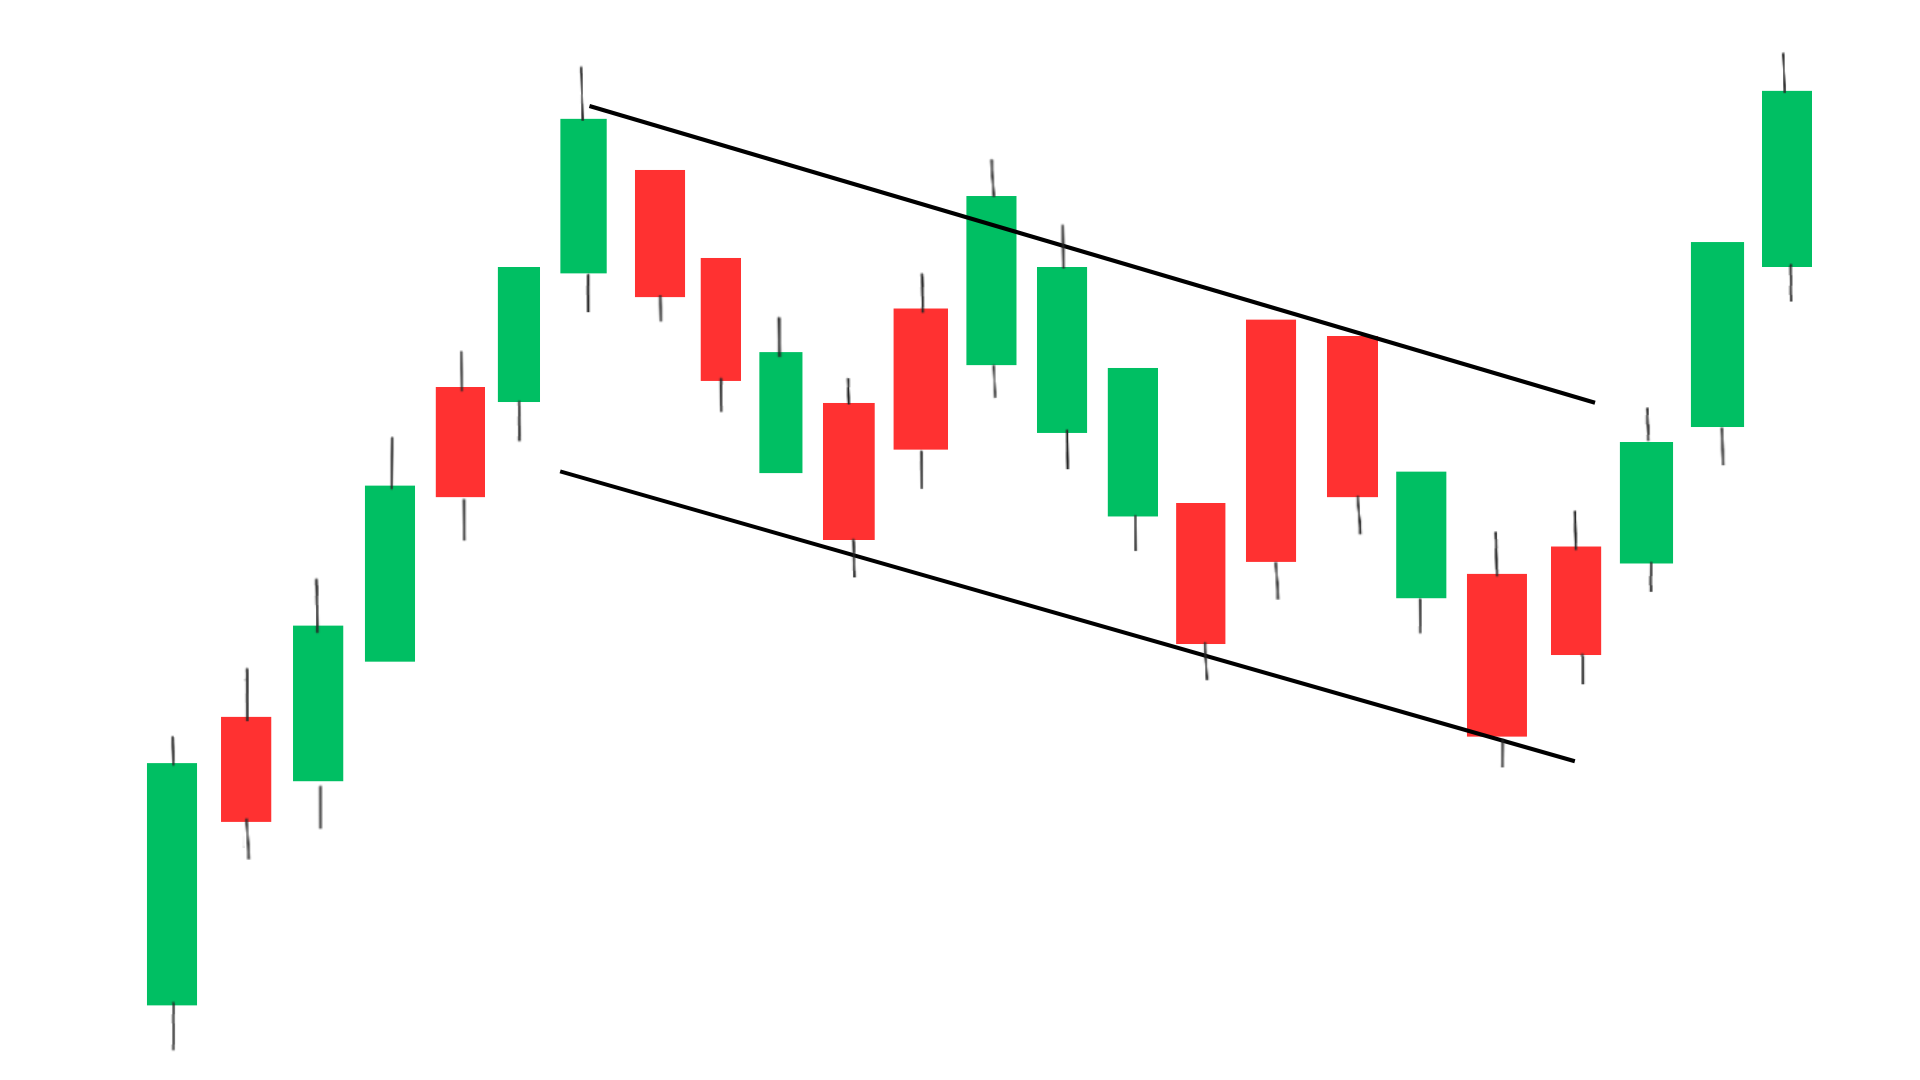
The channel down chart pattern is a bearish continuation pattern that forms when the price of an asset moves within a downward sloping channel. The channel is created by connecting a series of lower highs and lower lows, indicating a strong downtrend. Traders can identify this pattern by drawing trendlines along the highs and lows of the price movement.
Traders can identify this pattern by drawing trendlines along the highs and lows of the price movement. It is also termed as descending channel
How to Identify Channel down chart pattern?
To identify a channel down pattern, traders can follow these steps:
1. Downtrend Confirmation: Look for a clear downtrend in the price of an asset, characterized by lower highs and lower lows. This indicates that sellers are in control and the price is likely to continue moving lower.
2. Draw Trendlines: Connect the lower highs and lower lows with trendlines to form a downward sloping channel. The upper trendline connects the lower highs, while the lower trendline connects the lower lows. These trendlines establish the boundaries of the channel down pattern.
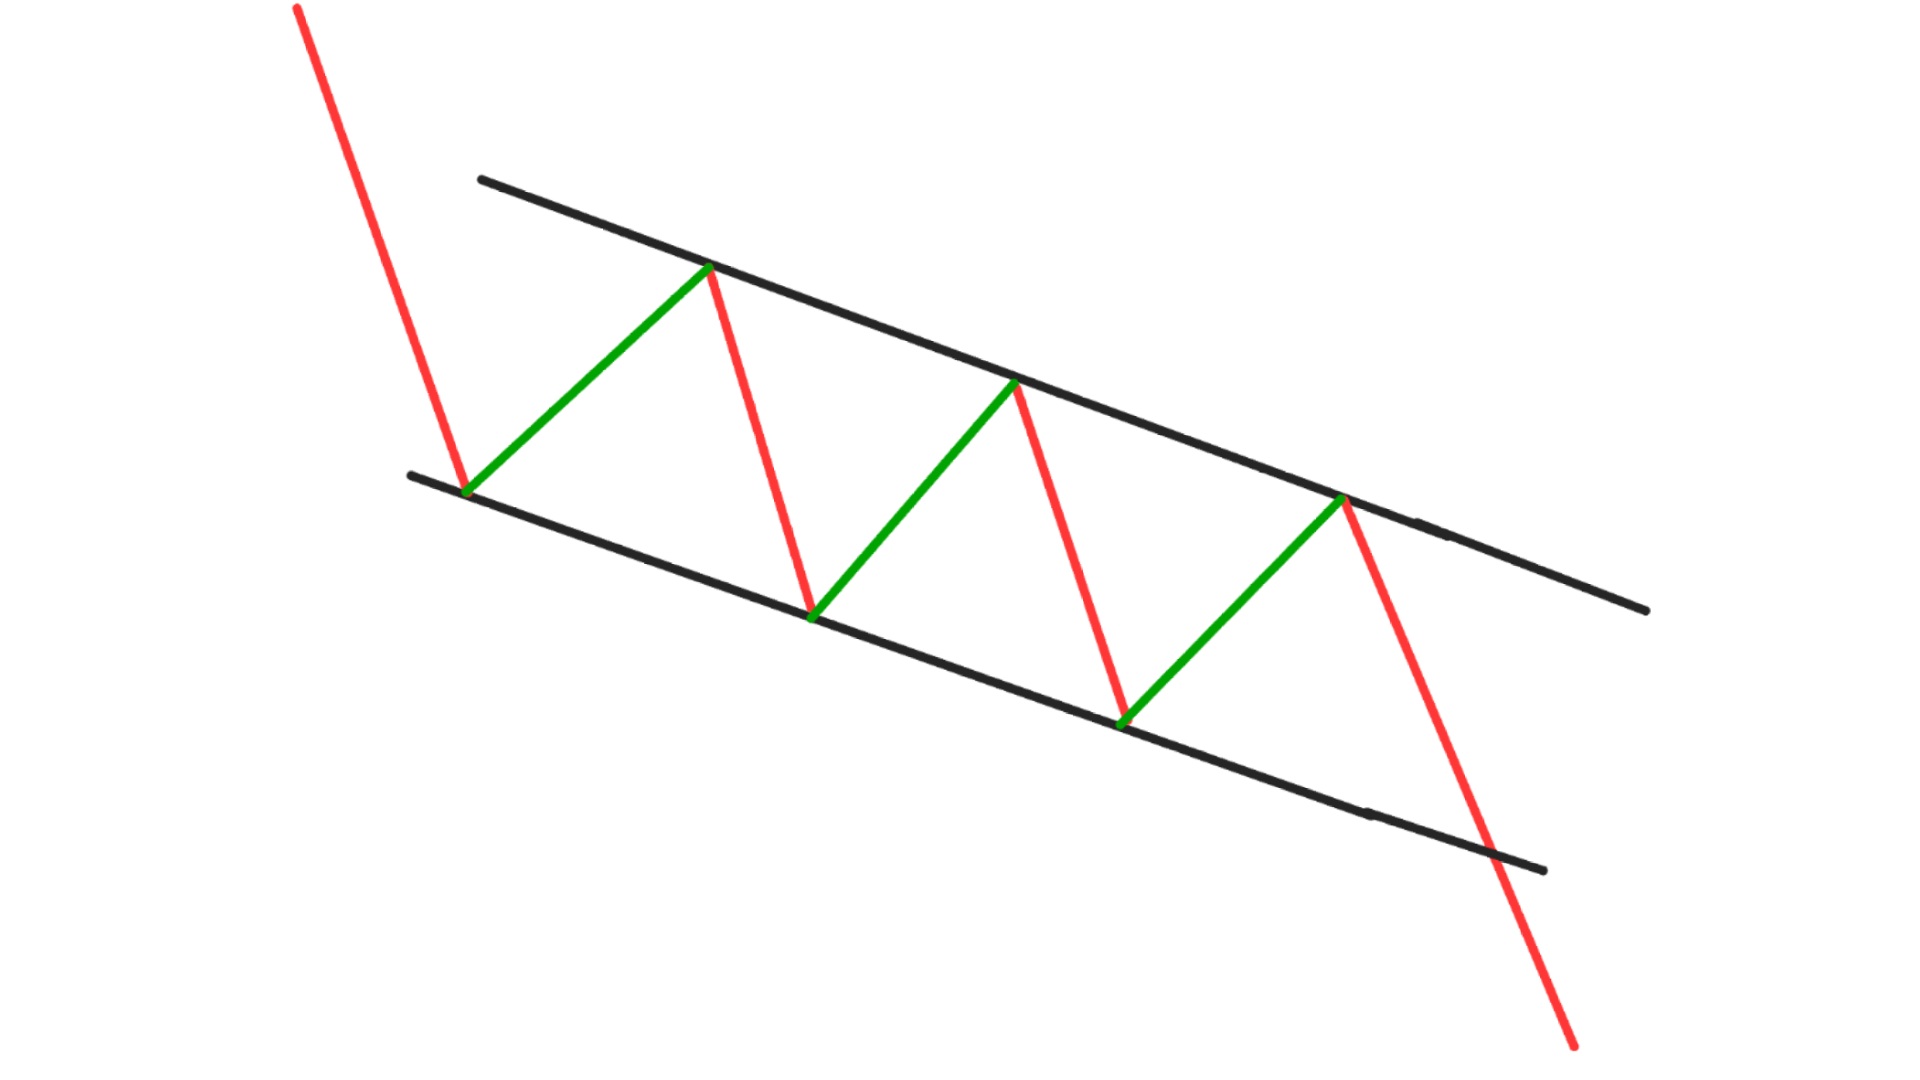
3. Multiple Touchpoints: The trendlines should have multiple touchpoints, meaning that the price bounces off these trendlines several times, confirming their validity. The more touchpoints there are, the stronger the channel down pattern.
4. Parallel Lines: The trendlines should be roughly parallel to each other, indicating a consistent downward slope in the price movement. If the trendlines converge or diverge significantly, it may not be a valid channel down pattern.
5. Volume Confirmation: Confirm the channel down pattern with volume analysis. Typically, volume should decrease as the price moves within the channel down pattern, signaling a lack of interest from buyers and supporting the downtrend.
6. Duration and Size: Consider the duration and size of the channel down pattern. A longer and larger channel down pattern is generally more reliable and indicative of a sustained downtrend.
By following these steps and conducting thorough technical analysis, traders can effectively identify a channel down pattern and use it as a basis for making informed trading decisions in the financial markets.
How channel down chart pattern is formed?
To identify a channel down pattern, traders can follow these steps:
1. Downtrend Confirmation: Look for a clear downtrend in the price of an asset, characterized by lower highs and lower lows. This indicates that sellers are in control and the price is likely to continue moving lower.
2. Draw Trendlines: Connect the lower highs and lower lows with trendlines to form a downward sloping channel. The upper trendline connects the lower highs, while the lower trendline connects the lower lows. These trendlines establish the boundaries of the channel down pattern.
3. Multiple Touchpoints: The trendlines should have multiple touchpoints, meaning that the price bounces off these trendlines several times, confirming their validity. The more touchpoints there are, the stronger the channel down pattern.
4. Parallel Lines: The trendlines should be roughly parallel to each other, indicating a consistent downward slope in the price movement. If the trendlines converge or diverge significantly, it may not be a valid channel down pattern.
5. Volume Confirmation: Confirm the channel down pattern with volume analysis. Typically, volume should decrease as the price moves within the channel down pattern, signaling a lack of interest from buyers and supporting the downtrend.
6. Duration and Size: Consider the duration and size of the channel down pattern. A longer and larger channel down pattern is generally more reliable and indicative of a sustained downtrend.
By following these steps and conducting thorough technical analysis, traders can effectively identify a channel down pattern and use it as a basis for making informed trading decisions in the financial markets.
How to Trade the Channel Down Chart Pattern:
Trading a channel down chart pattern involves looking for opportunities to enter short positions when the price is near the upper trendline of the channel and aiming to exit the trade when the price reaches the lower trendline.
Here are some steps to trade a channel down chart pattern:
1. Identify the channel down pattern: Look for a series of lower highs and lower lows that form a downward sloping channel on the price chart.
2. Wait for price to reach the upper trendline of the channel: Look for opportunities to enter short positions when the price reaches the upper trendline of the channel. This is typically a good entry point as it provides a favorable risk-reward ratio.
3. Set stop-loss and take-profit levels: Place a stop-loss order above the recent swing high or above the upper trendline of the channel to protect your position in case the price breaks out of the channel. Set a take-profit target near the lower trendline of the channel or at a previous support level.
4. Monitor the trade: Keep an eye on the price action and adjust your stop-loss and take-profit levels as needed. Consider trailing your stop-loss to lock in profits as the price moves in your favor.
5. Exit the trade: Close your position when the price reaches the lower trendline of the channel or if your stop-loss is hit. Take profits and evaluate your performance to learn from the trade.
Benefits of Using the Channel Down Chart Pattern:
The channel down chart pattern provides traders with a clear visual representation of a downtrend, making it easier to identify potential entry and exit points. By understanding this pattern, traders can take advantage of bearish market conditions and profit from downward price movements. Additionally, the channel down chart pattern can help traders set realistic profit targets and manage risk effectively.
Conclusion
In conclusion, mastering the channel down chart pattern can be a valuable tool for traders looking to capitalize on bearish market trends. By understanding how this pattern works and using it to guide their trading decisions, traders can improve their chances of success in the financial markets. Whether you are a beginner or an experienced trader, incorporating the channel down chart pattern into your trading strategy can help you navigate volatile market conditions and achieve your financial goals.
Frequently Asked Questions (FAQs)
1. What is a channel down pattern?
A channel down pattern is a technical analysis pattern that forms when an asset’s price is trending lower within two parallel trendlines. The upper trendline connects the lower highs, while the lower trendline connects the lower lows, creating a downward sloping channel.
2. What does a channel down pattern indicate?
A channel down pattern indicates a sustained downtrend in the price of an asset. It suggests that sellers are in control, leading to lower highs and lower lows. Traders often use this pattern to identify potential entry points for short positions or to confirm existing bearish trends.
3. How do you trade a channel down pattern?
Traders can trade a channel down pattern by selling near the upper trendline when the price reaches resistance and buying near the lower trendline when the price approaches support. They can also look for bearish signals, such as candlestick patterns or indicators, to confirm their trading decisions within the channel down pattern.
4. How reliable is a channel down pattern?
The reliability of a channel down pattern depends on various factors, such as the number of touchpoints on the trendlines, the duration of the pattern, and the volume confrmation. A well-defined channel with multiple touchpoints and decreasing volume supports the reliability of the pattern in signaling a downtrend.
5. Can a channel down pattern reverse into an uptrend?
While channel down patterns typically indicate a downtrend, they can sometimes reverse into an uptrend if the price breaks above the upper trendline with strong bullish momentum. Traders should monitor for potential breakout signals or reversal patterns to confirm a change in trend direction.
6. How can I confirm a channel down pattern?
Traders can confirm a channel down pattern by conducting thorough technical analysis, including assessing the trendlines for multiple touchpoints, checking for parallelism, analyzing volume patterns, and considering the duration and size of the pattern. Confirmation through additional technical indicators or price action signals can further strengthen the validity of the pattern.
