
Tweezer Bottom: A Bullish Signal for Traders
Technical analysis is a popular method used by traders to predict the future movements of financial markets. One of the most commonly used tools in technical analysis is candlestick charts, which help traders identify patterns and trends in price action. One such pattern is the tweezer bottom, which is a bullish signal that can indicate a potential reversal of a downtrend.

What is a Tweezer Bottom?
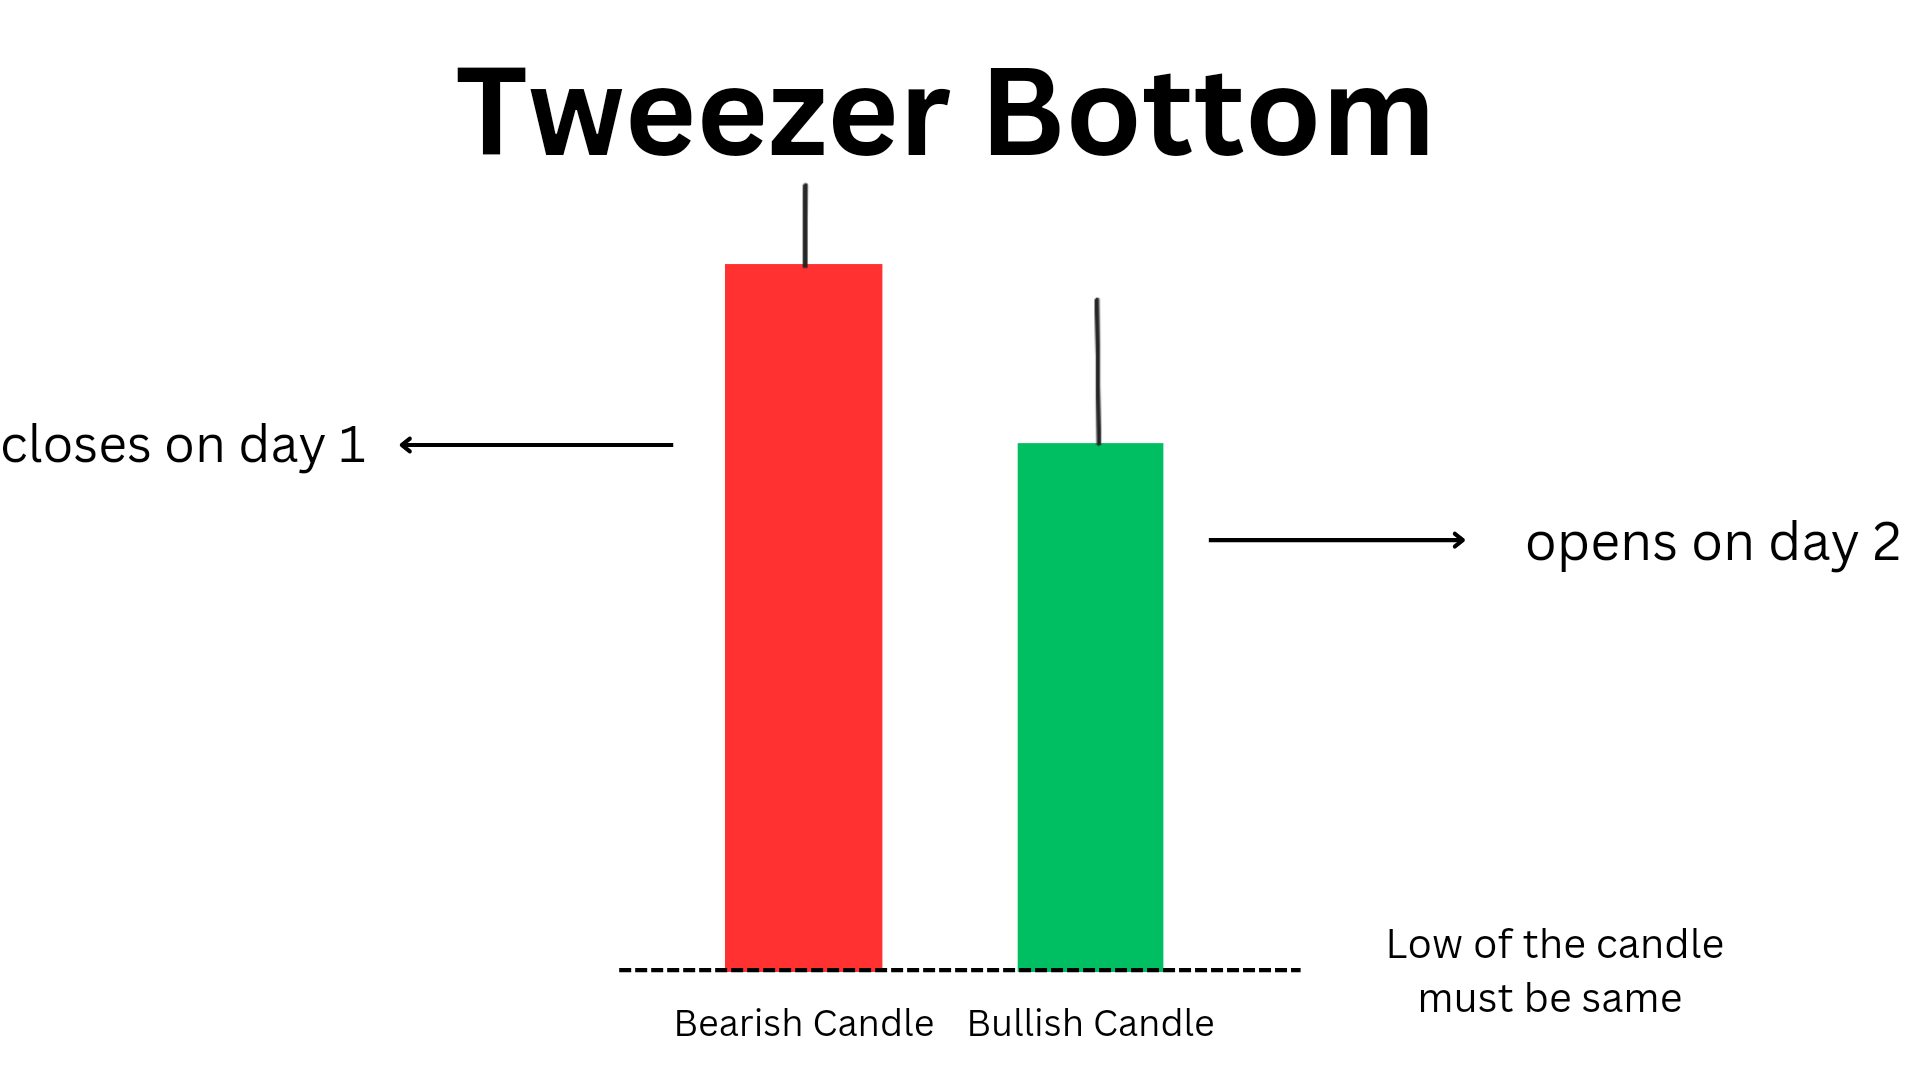
A tweezer bottom is a two candlestick bullish reversal candlestick pattern that occurs when two consecutive candlesticks have the same low price, but the second candlestick has a higher open and a higher close than the first candlestick. This pattern is considered a potential reversal signal when it appears at the bottom of a downtrend.
This pattern is bullish, as it can indicate that buyers are entering the market and pushing prices higher. As itIt is often seen as a sign of strength and can be used to confirm other bullish signals.
What does a tweezer bottom indicate?
- Tweezer bottoms occur when two consecutive candlesticks have the same low price, followed by a higher open and a higher close on the second candlestick.
- This pattern is considered a potential reversal signal when it appears at the bottom of a downtrend.
- There are three types of tweezer bottoms pattern: regular tweezer, long-legged doji tweezer, and dragonfly doji tweezer bottoms.
- It indicates a bullish signals that can indicate that buyers are entering the market and pushing prices higher.
- The first candle is formed on day 1 and the other candle is formed on day 2 having the low at same level.
Top Bestseller mastermind book to learn trading from scratch along with examples click here.
Types of Tweezer Bottoms candlestick pattern
There are three types of : regular , long-legged doji, and dragonfly doji tweezer bottoms.
- Regular Tweezer Bottoms: This is the most common type of tweezer bottom. It occurs when two consecutive candlesticks have the same low price, followed by a higher open and a higher close on the second candlestick.
- Long-Legged Doji Tweezer Bottoms: This pattern occurs when two consecutive long-legged doji candlesticks have the same low price, followed by a higher open and a higher close on the second candlestick. The long-legged doji candlestick has long upper and lower shadows, indicating that there is indecision in the market.
- Dragonfly Doji Tweezer Bottoms: This pattern occurs when two consecutive dragonfly doji candlesticks have the same low price, followed by a higher open and a higher close on the second candlestick. The dragonfly doji candlestick has a long lower shadow and no upper shadow, indicating that buyers are in control.
How to Trade Tweezer Bottoms?
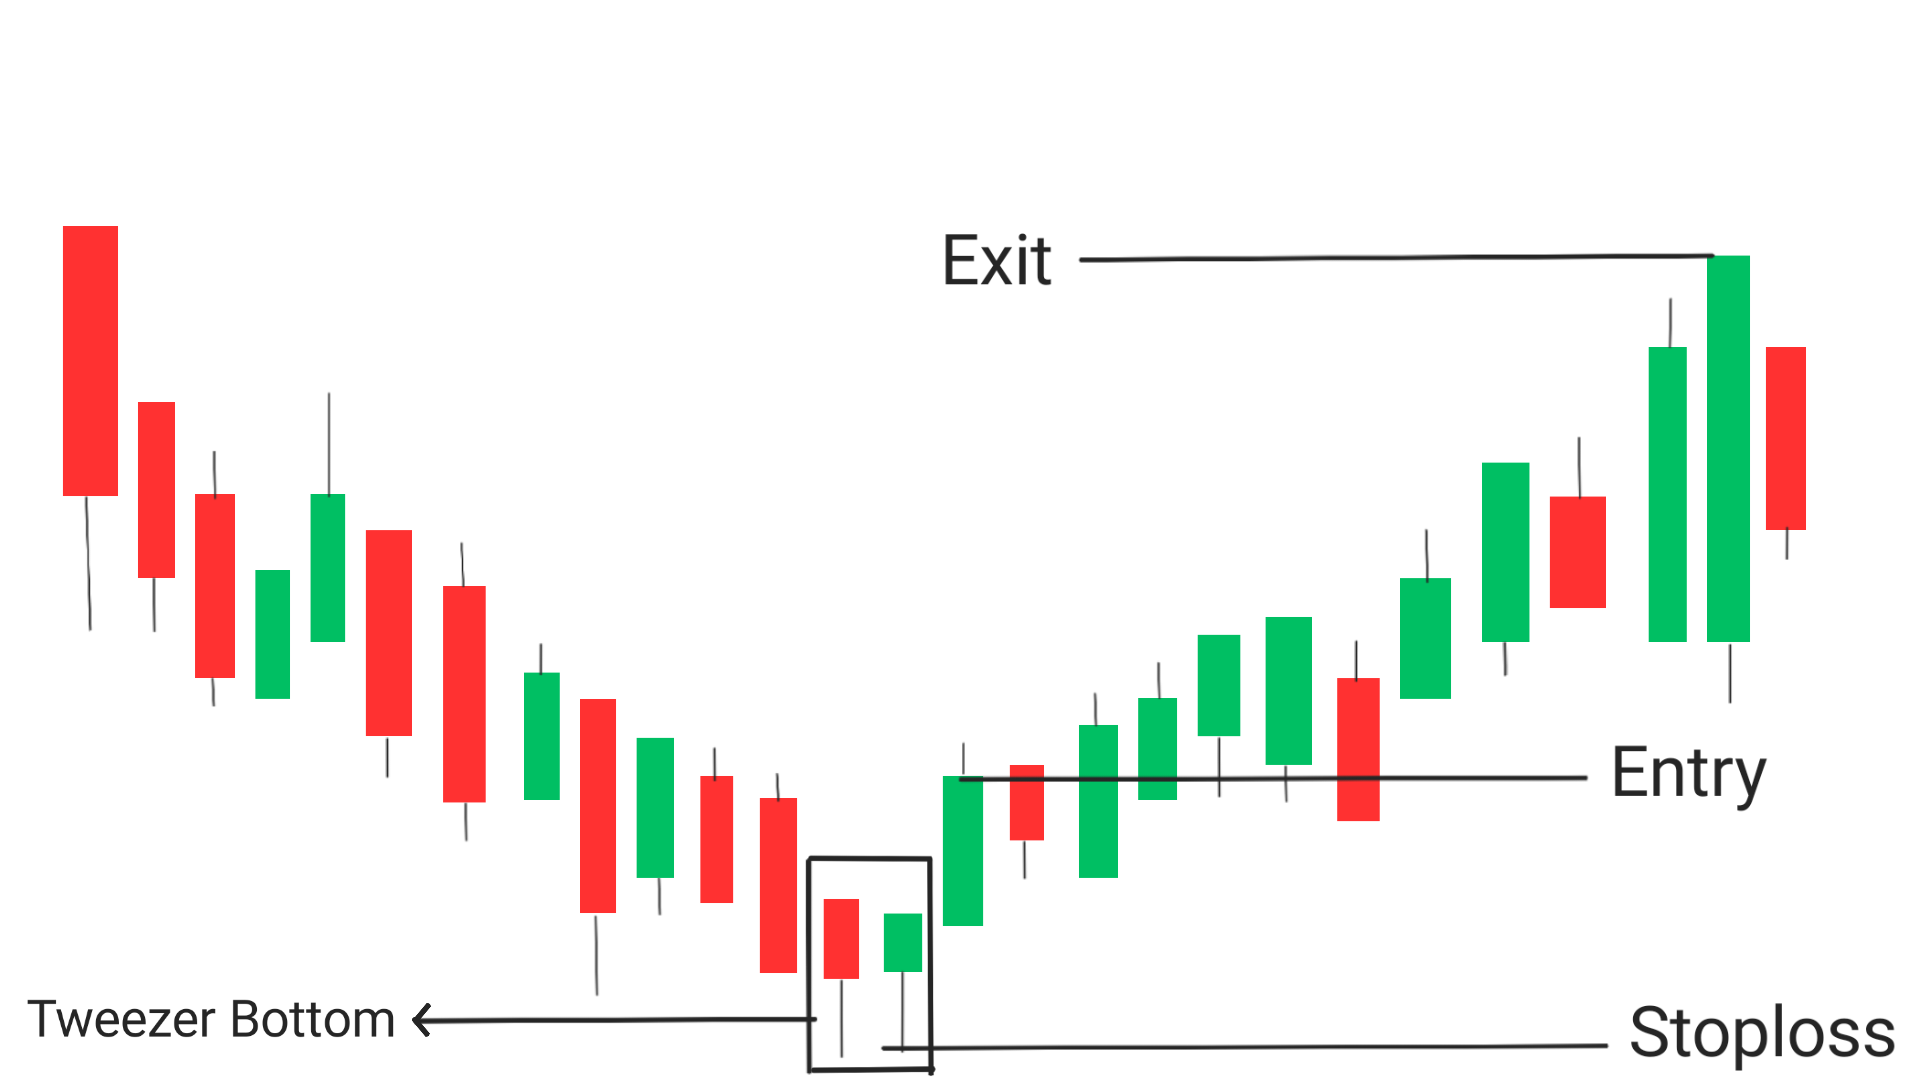
Entry: The best entry point while using this patternn is from the candle next to the tweezer top.
Exit: The best place to exit the trade is when it reaches a significant resistance level, if you wish to trade more you can look for a real breakout near resistance level and then take trade upto a new resistance level.
Stoploss: Stoploss must be set below the low of the tweezer bottom pattern i.e. the low of the pattern.
Points provided above are the best possible places for entry, exit and spoloss placement while trading.
Tweezer bottoms can be used to confirm other bullish signals, such as a bullish engulfing pattern or a hammer candlestick. Traders can enter long positions when they see a tweezer bottom pattern, with a stop-loss order placed below the low of the second candlestick.
NOTE: It is important to note that tweezer bottoms should not be used in isolation, but rather in conjunction with other technical indicators and analysis. Traders should also consider market conditions, such as volatility and volume, when making trading decisions.
Success Rate : The success rate of tweezer bottom is descent enough to make profit , there is not as such a no. but the success rate of tweezer top is nearly 60%.
Conclusion
Tweezer bottoms are a bullish candlestick pattern that can indicate a potential reversal of a downtrend. Traders can use this pattern to confirm other bullish signals and enter long positions. However, it is important to use this pattern in conjunction with other technical indicators and analysis, and to consider market conditions when making trading decisions.
Frequently Asked Questions (FAQs)
1.What does a tweezer bottom indicate?
A tweezer bottom indicates a bearish reveral, it can convert downtrend into uptrend. This candlestick pattern that occurs when two candlesticks have the same low price, indicating a potential reversal of a downtrend.
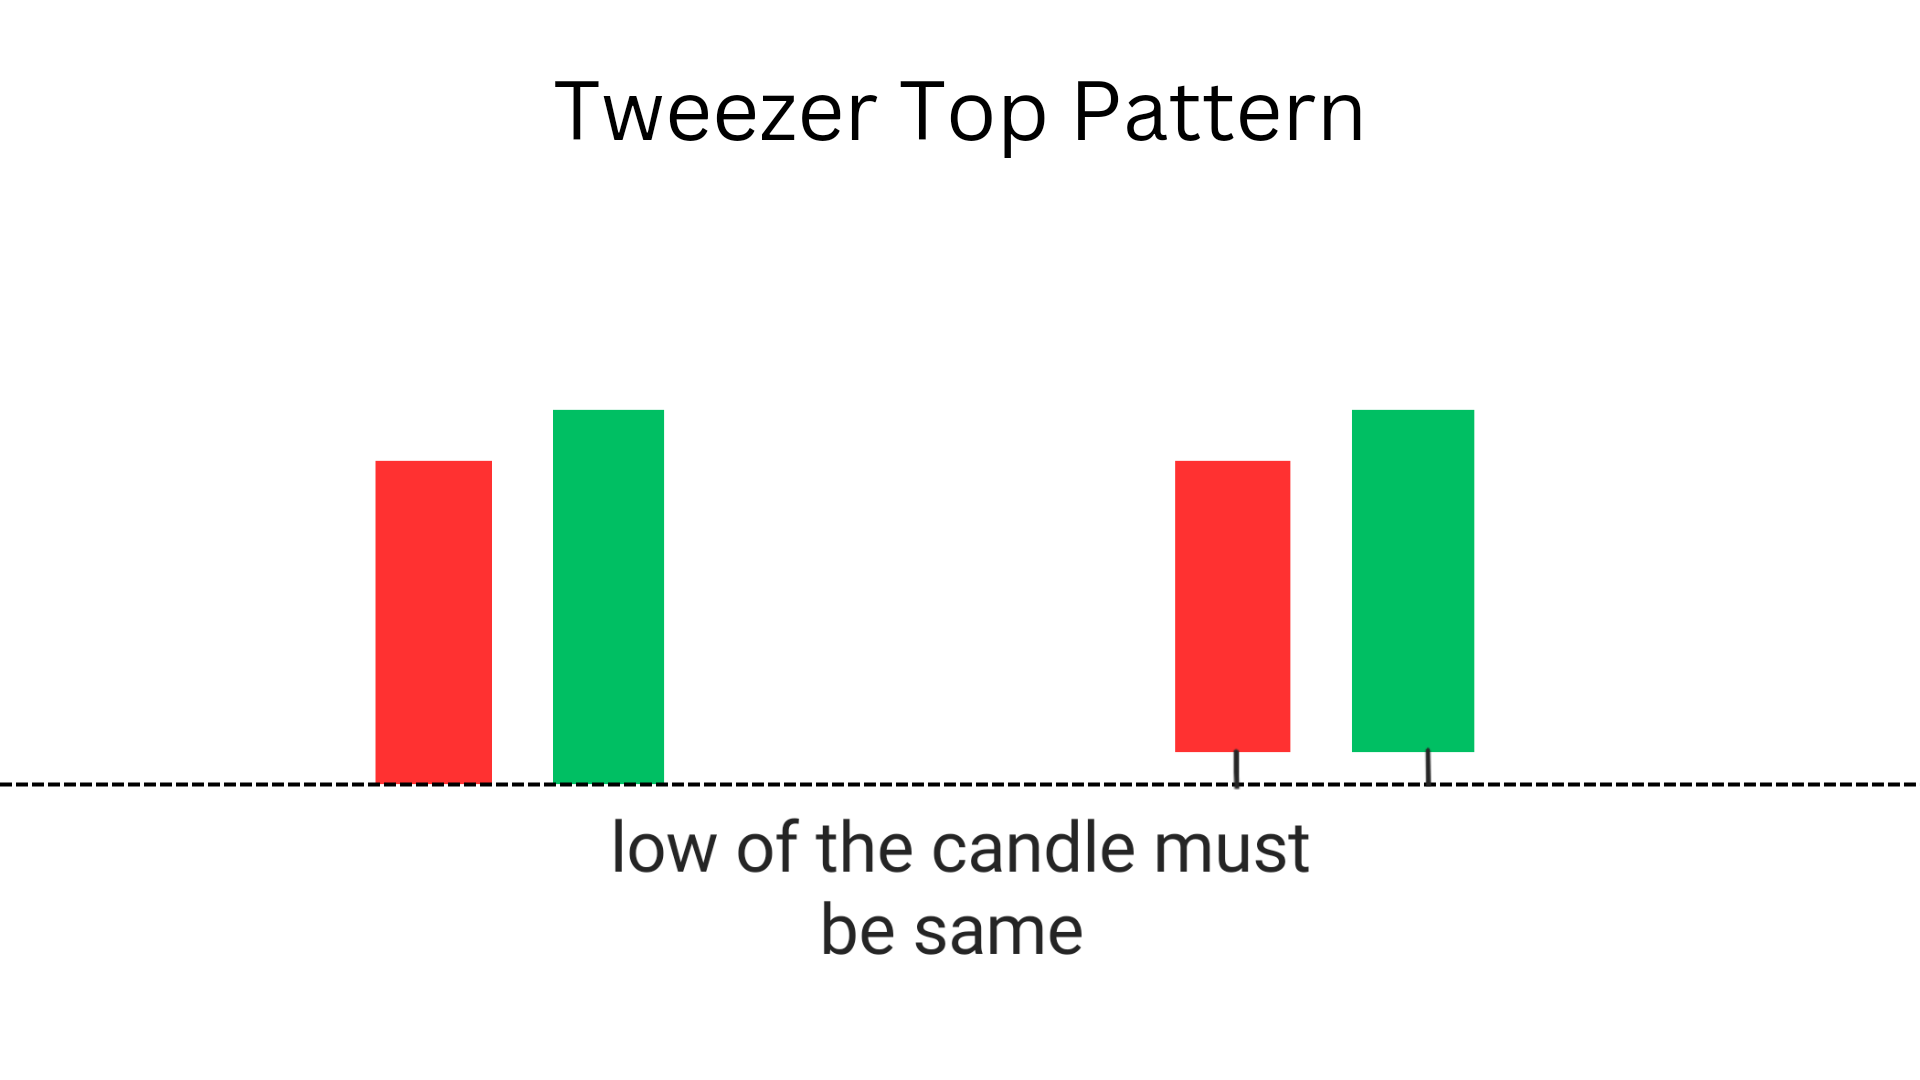
2.What is the psychology behind the tweezer top?
The psychology behind a tweezer top is that it shows a struggle between buyers and sellers. The first candlestick represents buying pressure, while the second candlestick represents selling pressure. This pattern suggests that the market may be losing momentum and could potentially reverse.
3.What are the different tweezer candles?
There are different types of tweezer candles, including bullish tweezer bottoms, bearish tweezer tops, and neutral tweezer patterns.
4.Is tweezer good or bad?
Tweezer is descent good enough to make profit but,Whether a tweezer pattern is good or bad depends on the context of the market and other technical indicators. It can indicate a potential reversal or continuation of a trend.
5.What is tweezer and its uses?
Tweezer is a technical analysis tool used by traders to identify potential trend reversals. It involves analyzing candlestick patterns to look for two or more candlesticks with the same high or low price. Traders use this information to make decisions about buying or selling assets.
6. What does a bottom of this candle indicate?
A bottom of this pattern is a bullish signal that can indicate that buyers are entering the market and pushing prices higher.
7. How can traders use the tweezer pattern?
Traders can use the this pattern to confirm other bullish signals and enter long positions, but should use it in conjunction with other technical indicators and analysis, and consider market conditions when making trading decisions.
