

5 Types Of Doji Candlesticks
Doji candlesticks are among the most famous and versatile patterns in technical analysis. They can signal indecision, reversal, continuation, or confirmation, depending on their shape, size, and position relative to other candles. In this article, we will explore the various types of doji candlesticks and their implications for price action.

What is a Doji Candlestick?
A doji candlestick is a candlestick pattern that signals indecision between buyers and sellers, it has almost the same opening and closing prices, resulting in a small to no real body. The term “doji” comes from the Japanese word for “at the same time” or “doubtful.” A doji represents a balance between buyers and sellers, as neither side could gain a decisive advantage during the session.
The Four Basic Types of Doji Candlesticks
There are four basic types of doji candlesticks, each with its own characteristics and interpretations. These are:
- Common Doji
- Long-Legged Doji
- Dragonfly Doji
- Gravestone Doji
- Four-Price Doji
Let’s look at each types od doji in more detail.
1. Common Doji
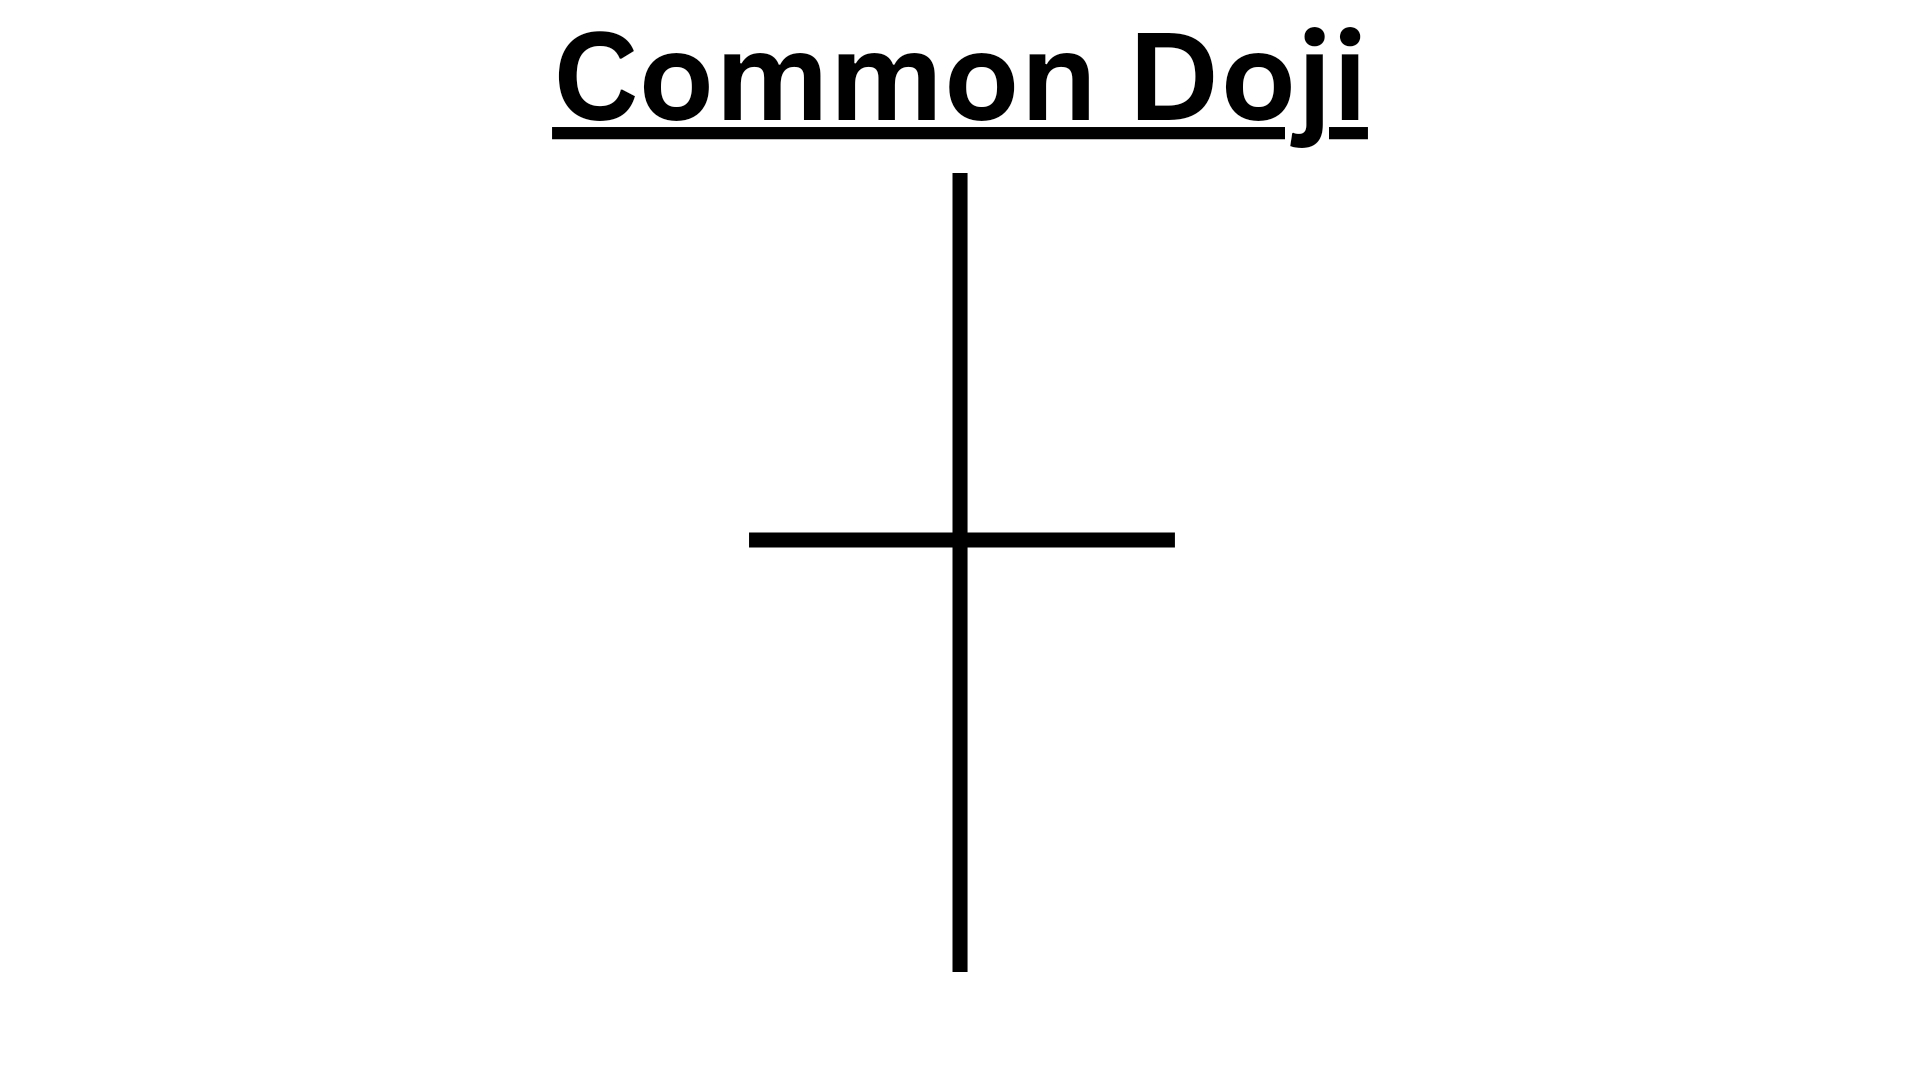
A doji is a candlestick pattern in technical analysis that occurs when the opening and closing prices of an asset are very close or equal, resulting in a small or non-existent body. The most common type of doji is the standard doji, which is characterized by a horizontal line for the body and equally long upper and lower shadows.
2. Long-Legged Doji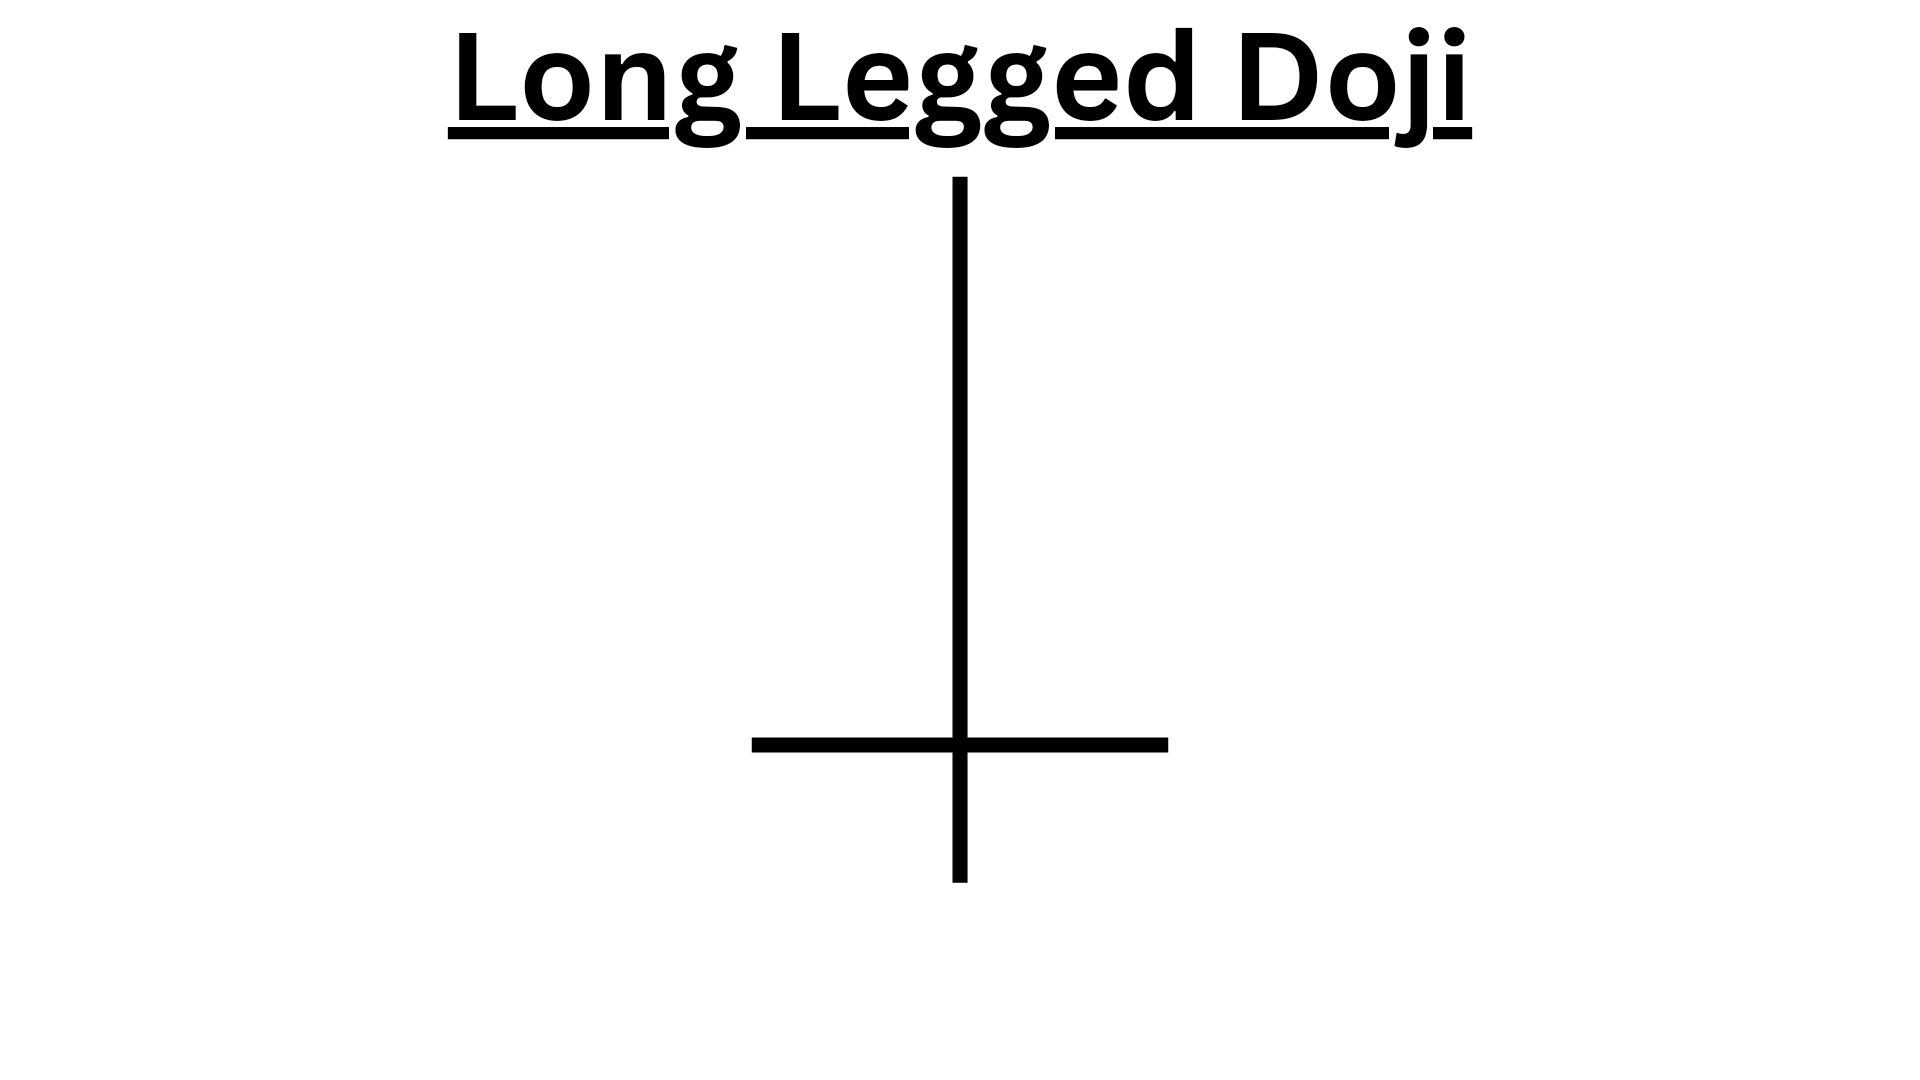
A long-legged doji is a doji candlestick that has long upper and lower shadows (also called wicks or tails) relative to its real body. The length of the shadows indicates that there was a significant price movement during the session, but it was ultimately reversed or negated by the end of the session. A long-legged doji can also indicate that a trend is losing momentum or reversing, as the bulls and bears are evenly matched.
Following are the key features of a long-legged doji:
A long-legged doji is a candlestick pattern that has the following features:
1. It has a long upper and lower shadow, which indicates that there was significant price movement during the trading session.
2. The opening and closing prices are very close to each other, indicating indecision in the market.
3. It is a reversal pattern that suggests a potential change in trend direction.
4. It is more significant when it occurs after a prolonged uptrend or downtrend.
5. It is often considered a sign of market volatility and uncertainty.
6. Traders often use this pattern as a signal to enter or exit a trade, depending on the prevailing trend and other technical indicators.
3. Dragonfly Doji
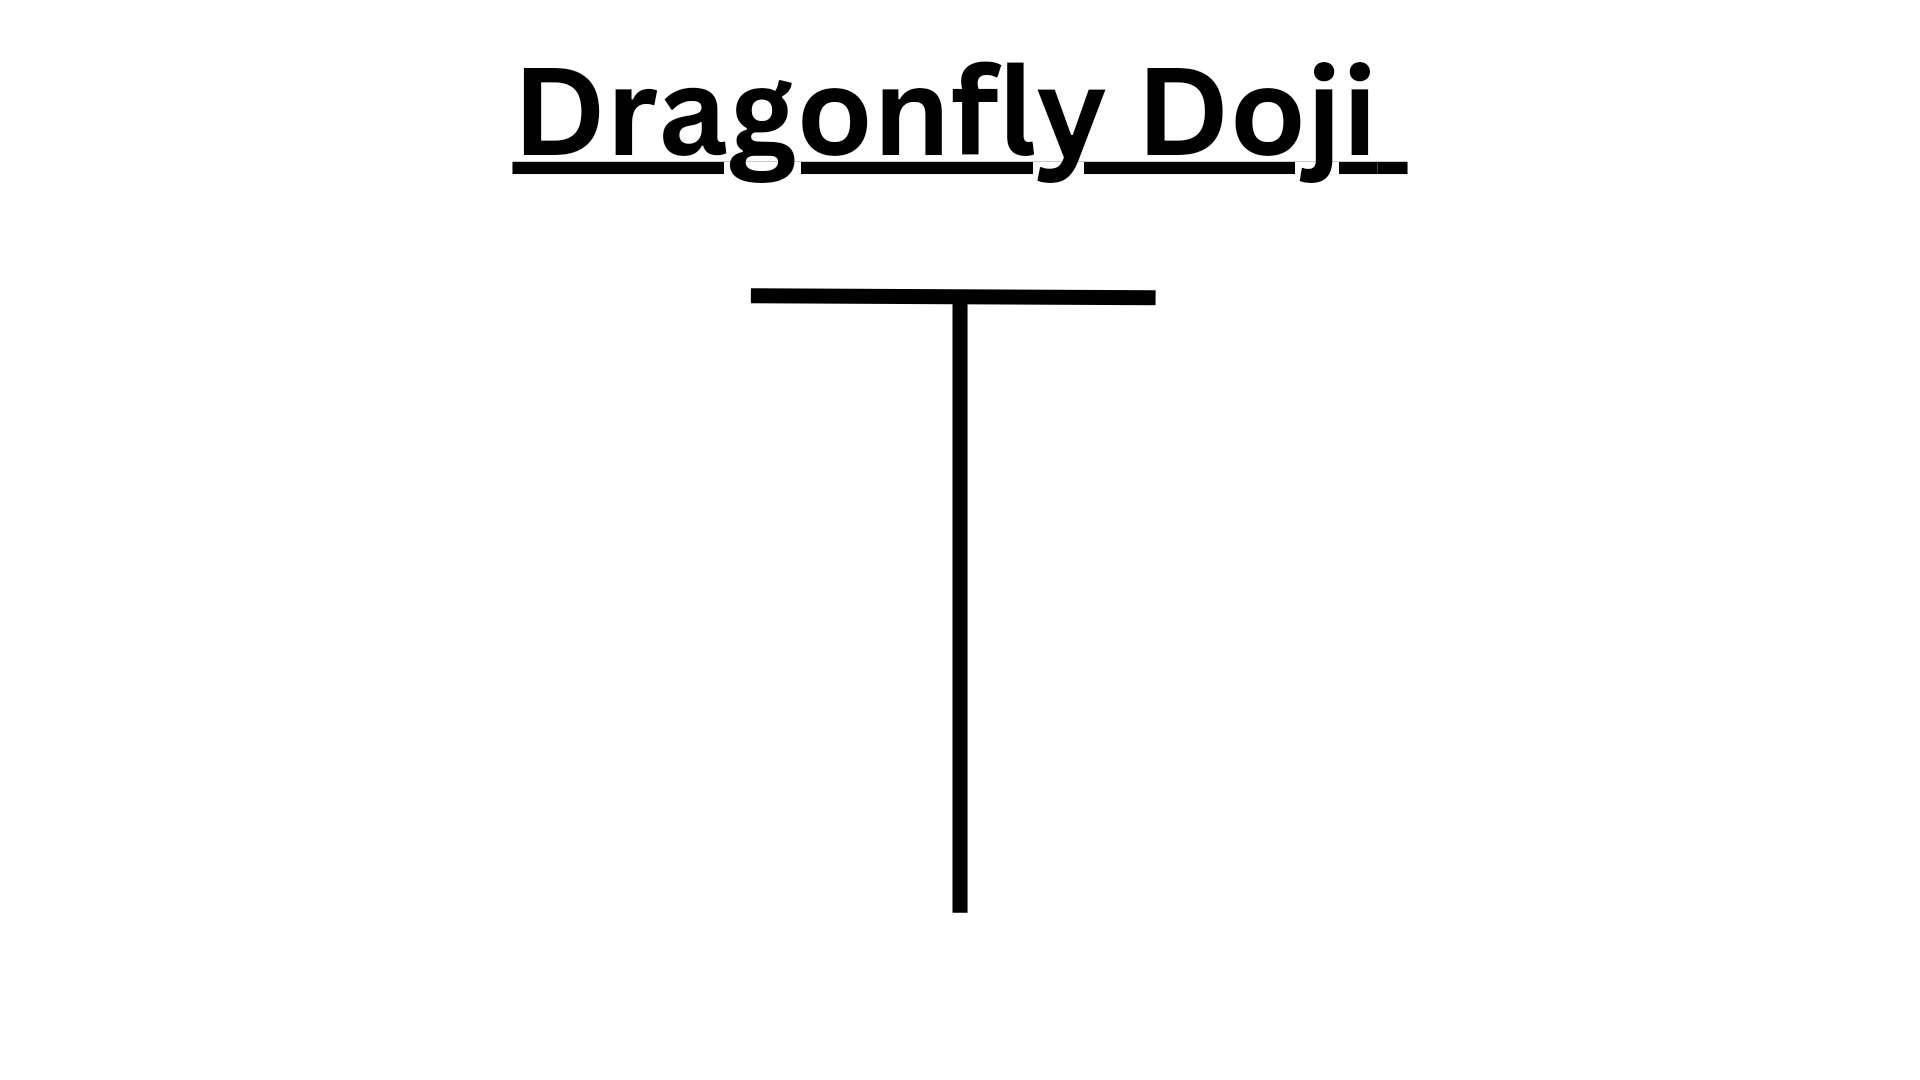
A dragonfly doji is a doji candlestick that has a long lower shadow but no upper shadow or a very short one. The shape of the candlestick resembles a dragonfly, hence the name. A dragonfly doji can indicate that buyers have regained control after a period of selling pressure, as they have managed to push the price up from the session low. A dragonfly doji can also suggest that a support level has held or that a reversal is imminent, as the bears have failed to push the price down despite their efforts.
A dragonfly doji is a candlestick pattern that has the following features:
1. It has a long lower shadow and no upper shadow, indicating that the opening and closing prices were at or near the high of the trading session.
2. The opening and closing prices are very close to each other, indicating indecision in the market.
3. It is a reversal pattern that suggests a potential change in trend direction.
4. It is more significant when it occurs after a prolonged downtrend.
4. Gravestone Doji
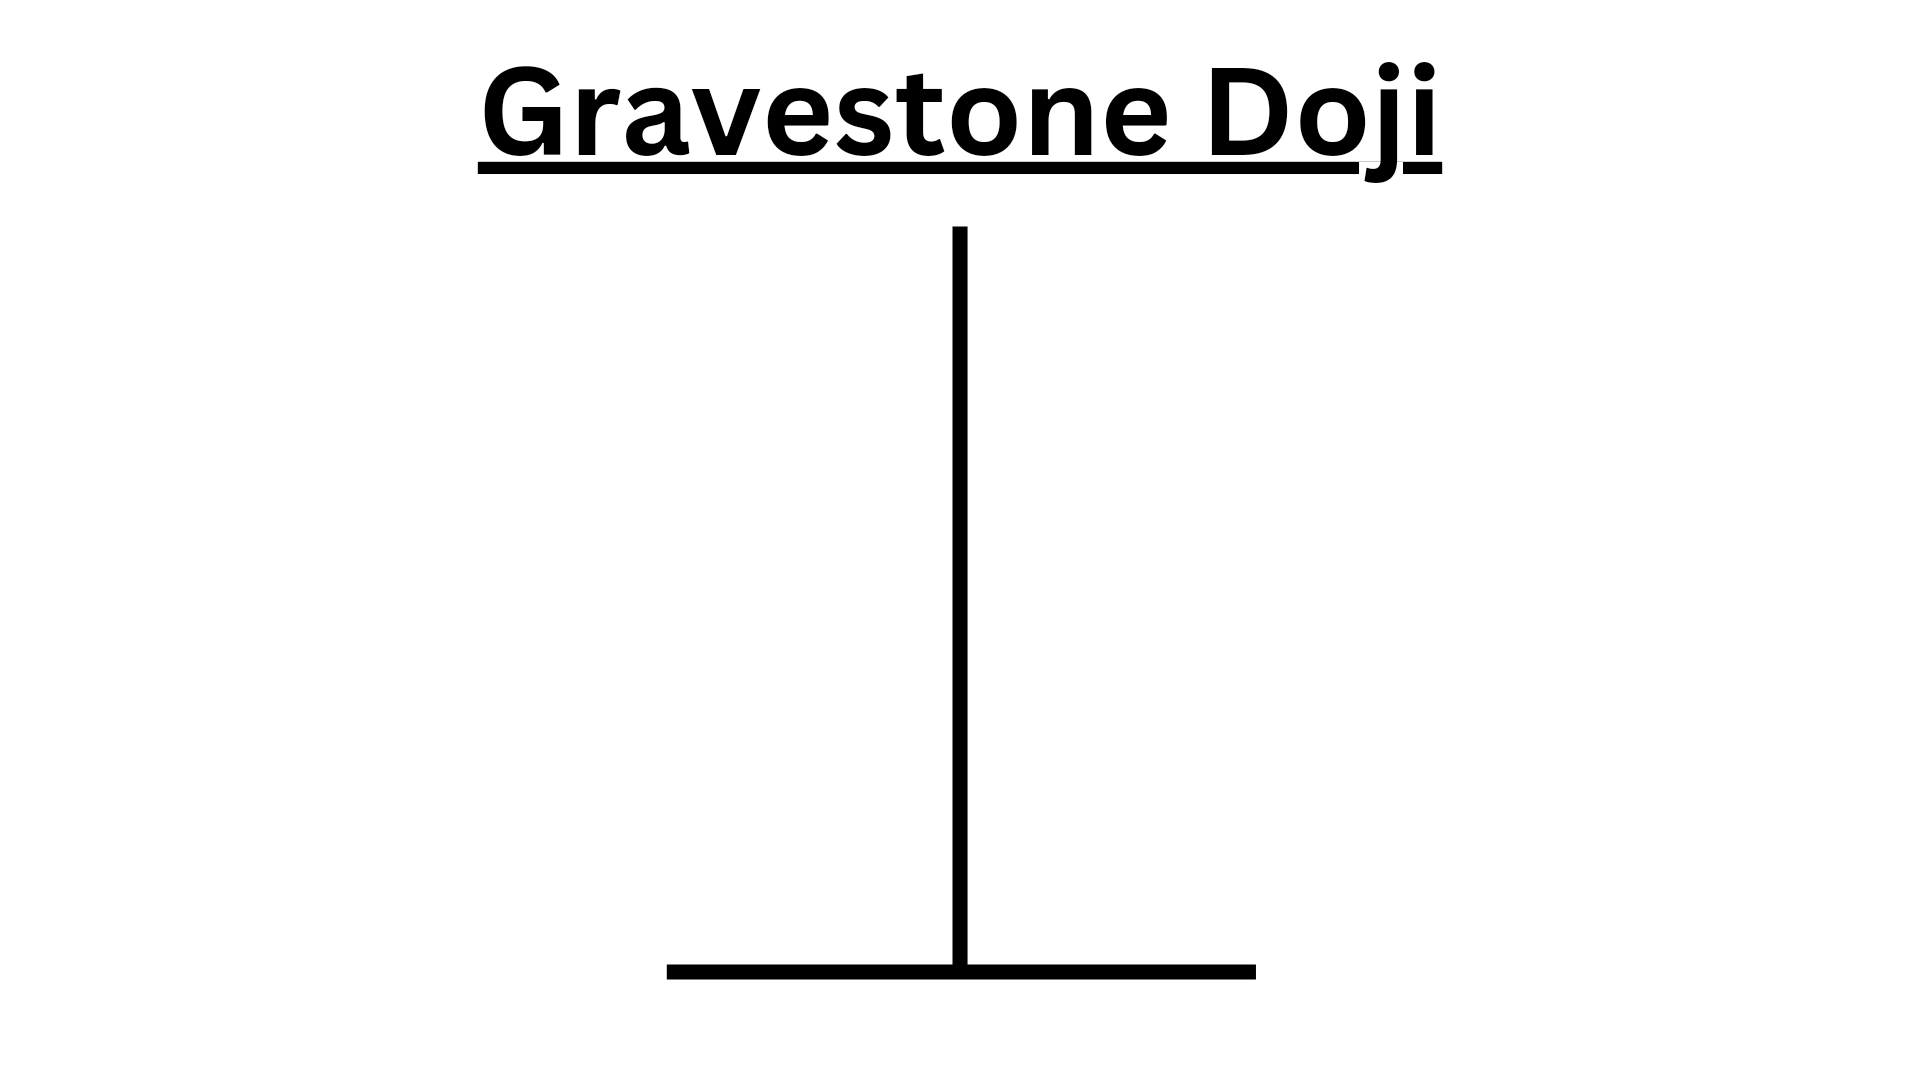
A gravestone doji is a doji candlestick that has a long upper shadow but no lower shadow or a very short one. The shape of the candlestick resembles a gravestone, hence the name. A gravestone doji can indicate that sellers have regained control after a period of buying pressure, as they have managed to push the price down from the session high. A gravestone doji can also suggest that a resistance level has held or that a reversal is imminent, as the bulls have failed to push the price up despite their efforts.
A gravestone doji is a candlestick pattern that has the following features:
1. It has a long upper shadow and no lower shadow, indicating that the opening and closing prices were at or near the low of the trading session.
2. The opening and closing prices are very close to each other, indicating indecision in the market.
3. It is a reversal pattern that suggests a potential change in trend direction.
4. It is more significant when it occurs after a prolonged uptrend.
5. Four-Price Doji
A four-price doji is a doji candlestick that has the same opening, closing, high, and low prices. The candlestick looks like a cross or a plus sign, hence the name. A four-price doji is rare but significant, as it indicates complete indecision and equilibrium between buyers and sellers. A four-price doji can suggest that a major turning point is approaching, as the market is at a critical juncture where any small catalyst could trigger a big move in either direction.
A four price doji is a candlestick pattern that has the following features:
1. It has no or very small upper and lower shadows, indicating that the opening and closing prices were very close to each other.
2. The high and low prices are also very close to the opening and closing prices, creating a small rectangular shape.
3. It is a rare pattern that suggests a period of indecision in the market.
4. It is often considered a sign of market volatility and uncertainty.
these are the most common types of doji , which are commonly used while trading.
Top Bestseller mastermind book to learn trading from scratch along with examples click here.
What does all types doji candles tells you?
While the four basic types of doji candlesticks provide a useful framework for understanding their shapes and shadows, dojis can also have different meanings depending on their context and the patterns they form with other candles. Here are some examples of how dojis can be interpreted in different situations:
1. Doji as Reversal Signal
A doji can be a powerful reversal signal when it appears after a trend has been established, especially if it forms a pattern with other candles that confirms the reversal. For example, a bullish doji star is a three-candle pattern that consists of a long bearish candle, followed by a doji, and then a long bullish candle.
This pattern suggests that the bears have lost control and that the bulls are taking over, as evidenced by the long bullish candle that confirms the bullish sentiment of the doji. Similarly, a bearish doji star is a three-candle pattern that consists of a long bullish candle, followed by a doji, and then a long bearish candle. This pattern suggests that the bulls have lost control and that the bears are taking over, as evidenced by the long bearish candle that confirms the bearish sentiment of the doji.
2. Doji as Continuation Signal
A doji can also be a continuation signal when it appears within a trend, especially if it forms a pattern with other candles that confirms the continuation. For example, a bullish harami cross is a two-candle pattern that consists of a long bearish candle, followed by a doji that is completely inside the real body of the first candle.
This pattern suggests that the bears are losing momentum and that the bulls are regaining strength, as evidenced by the small real body of the doji that shows indecision but not weakness. Similarly, a bearish harami cross is a two-candle pattern that consists of a long bullish candle, followed by a doji that is completely inside the real body of the first candle. This pattern suggests that the bulls are losing momentum and that the bears are regaining strength, as evidenced by the small real body of the doji that shows indecision but not strength.
3. Doji as Confirmation Signal
A doji can also be a confirmation signal when it appears after a strong move, especially if it forms a pattern with other candles that confirms the direction. For example, a bullish engulfing pattern is a two-candle pattern that consists of a long bearish candle, followed by a long bullish candle that completely engulfs the first candle, including its real body and shadows.
This pattern suggests that the bulls have taken over and that the bears are retreating, as evidenced by the strong bullish sentiment of the second candle that confirms the bullish sentiment of the doji. Similarly, a bearish engulfing pattern is a two-candle pattern that consists of a long bullish candle, followed by a long bearish candle that completely engulfs the first candle, including its real body and shadows. This pattern suggests that the bears have taken over and that the bulls are retreating, as evidenced by the strong bearish sentiment of the second candle that confirms the bearish sentiment of the doji.
Conclusion
Doji candlesticks are fascinating and versatile tools for technical analysis. By understanding their shapes, shadows, and patterns, traders can gain valuable insights into market sentiment and make more informed decisions. Whether you are looking for reversal signals, continuation signals, or confirmation signals, dojis can provide you with a wealth of information that can help you stay ahead of the curve. So next time you see a doji on your chart, don’t be doubtful or indecisive – be curious and creative!
Difference between all types of doji
In this article, we have explored the four basic types of doji candlesticks: long-legged doji, dragonfly doji, gravestone doji, and four-price doji.
- A long-legged doji has long upper and lower shadows, indicating uncertainty or volatility in the market.
- A dragonfly doji has a long lower shadow but no upper shadow or a very short one, suggesting that buyers have regained control or a support level has held.
- A gravestone doji has a long upper shadow but no lower shadow or a very short one, indicating that sellers have regained control or a resistance level has held.
- A four-price doji has the same opening, closing, high, and low prices, indicating complete indecision and equilibrium between buyers and sellers.
Additionally, we have discussed how dojis can have different meanings depending on their context and the patterns they form with other candles, such as reversal signals, continuation signals, or confirmation signals.
Place of formation and their nature of all types of doji
Doji patterns can form in any market and on any timeframe. The nature of each type of doji depends on its shape, size, and placement in the overall trend.
1. Standard Doji: This is the most basic form of doji where the opening and closing prices are almost identical, resulting in a small or non-existent body. It can signal indecision in the market and a possible reversal or continuation of the trend.
2. Long-Legged Doji: This doji has long upper and lower shadows, indicating that there was significant price movement during the trading session, but ultimately ended up where it started. It can signal uncertainty in the market and a potential reversal.
3. Dragonfly Doji: This doji has a long lower shadow and no upper shadow, indicating that buyers pushed the price up from the opening, but eventually sellers brought it back down to the opening price. It can signal a bullish reversal.
4. Gravestone Doji: This doji has a long upper shadow and no lower shadow, indicating that sellers pushed the price down from the opening, but eventually buyers brought it back up to the opening price. It can signal a bearish reversal.
5. Four Price Doji: This doji has all four prices (open, close, high, and low) at the same level, indicating a complete lack of price movement during the trading session. It can signal a possible reversal or continuation of the trend.
Overall, doji patterns can provide valuable information about market sentiment and potential reversals, but should not be relied upon as the sole indicator for making trading decisions. It is important to consider other technical indicators and fundamental analysis before making any trades.
Frequently Asked Questions (FAQs)
1.Is a Doji a bull or bear?
1. A Doji candlestick pattern can be either bullish or bearish, depending on the context and market conditions. It indicates that there is indecision in the market and that buyers and sellers are evenly matched.
2.What is the meaning of 4 price Doji?
four-price Doji pattern is a type of Doji candlestick pattern where the opening, closing, high, and low prices are all at or very close to the same level. This suggests that there was complete indecision in the market during that period.
3.What does 3 Doji in a row means
Three Doji in a row can indicate a potential reversal in the market. It suggests that there is a lot of indecision and uncertainty among traders, and that the market may be preparing to change direction. However, it is important to consider other technical indicators and market conditions before making any trading decisions.
4.What is a long-legged doji pattern?
A: A long-legged doji pattern is a type of doji candlestick pattern where the opening and closing prices are near the same level, but the high and low prices are significantly further apart. This suggests that there was a lot of volatility and indecision in the market during that period.
5. What is a gravestone doji pattern?
A: A gravestone doji pattern is a type of doji candlestick pattern where the opening and closing prices are at or near the low of the period, with a long upper shadow. This indicates that sellers were in control during the period, but buyers stepped in to push the price up from the lows.
6. What is a dragonfly doji pattern?
A: A dragonfly doji pattern is a type of doji candlestick pattern where the opening and closing prices are at or near the high of the period, with a long lower shadow. This indicates that buyers were in control during the period, but sellers stepped in to push the price down from the highs.
7. What is a four-price doji pattern?
A: A four-price doji pattern is a type of doji candlestick pattern where the opening, closing, high, and low prices are all at or very close to the same level. This suggests that there was complete indecision in the market during that period.
