
How To Trade Triple Bottom Pattern? Example with 5FAQs
Technical analysis is the most reliable method used by traders to analyze the market and make profitable trades. It involves studying charts and identifying patterns that can indicate potential trend reversals or continuation.
One of the most commonly used patterns in technical analysis is the triple bottom pattern. This pattern is a bullish reversal pattern that can provide traders with a clear signal to enter a long position.

In this blog, we will discuss what is the triple bottom pattern?, how it works, and how traders can use it to make profitable trades. We will also provide examples of the triple bottom pattern in action and discuss some of the potential pitfalls that traders should be aware of. After the end of this blog, You can easily take right decisions after reading this.
What is the Triple Bottom Pattern?
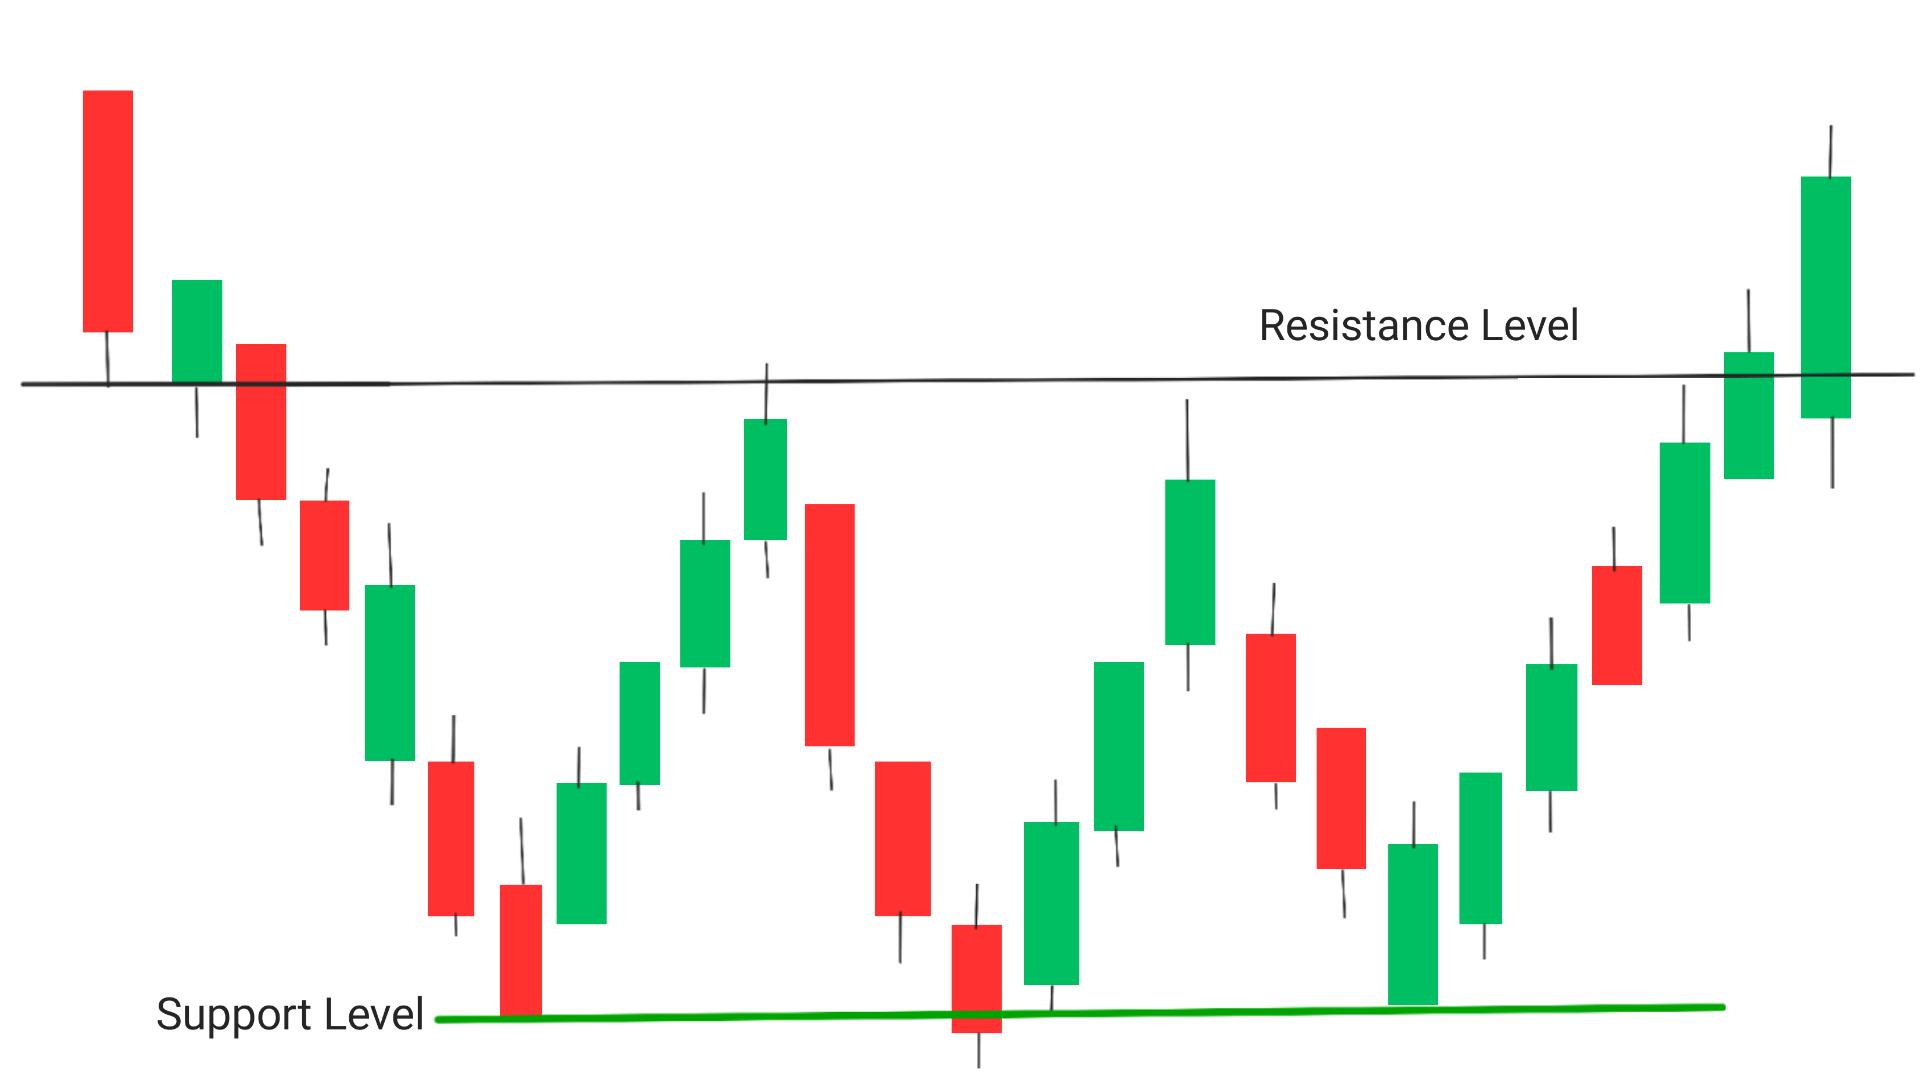
triple bottom Thepattern is a bullish reversal chart pattern that forms after a downtrend. It consists of three lows that are roughly equal in price(there can be a difference of 1-3% ) and separated by short-term highs. The pattern is confirmed when the price breaks above the resistance level formed by the highs between the three lows.
The three lows in the pattern represent a period of selling pressure, but each time the price reaches a new low, buyers step in and push the price back up. The pattern is considered to be complete when the price breaks above the resistance level, which indicates that buyers have taken control of the market and a new uptrend may be starting. Sometimes, This pattern is also termed as Three Rivers Pattern.
What Are The Properties Of Three Bottom Pattern?
- The volume of candle after the first low is higher than the other two.
- The volume of candle at second low is less than the first low.
- The volume at third low is also less than that of 1st low.
- If the resistance at the second high is smaller than or equal to that of 1st low , Then it is referred as a good and the accuracy of chart pattern increases.
- There must be atleast 7-8 candles between two consecutive lows, if it does’nt happens then it won’t be consisdered as a valid three bottom chart pattern.
- This pattern can be formed in any time frame and can work properly.
Gap Between Two Consecutive Lows In Different Time Frames on daily chart basis
| Type Of Investment | Gap Between Two highs |
|---|---|
| Intraday Chart | 7-8 Candles Gap |
| Short Term | 3-4 Weeks Gap |
| Medium Term | 3-4 Months Gap |
| Long Term | 1-2 Years or more |
How does the Triple Bottom Pattern work?
The triple bottom pattern works by indicating a shift in market sentiment from bearish to bullish.
- The first low represents a period of selling pressure, but buyers step in and push the price back up.
- The second low confirms that buyers are willing to support the price at that level, and the third low indicates a strong level of support.
When the price breaks above the resistance level, it signals that buyers have taken control of the market and a new uptrend may be starting. Traders can use this signal to enter a long position with the expectation that the price will continue to rise.
How can traders use the Triple Bottom chart Pattern?
Traders can use the triple bottom pattern to identify potential buying opportunities. They can enter a long position when the price breaks above the resistance level, with a stop loss below the lowest low in the pattern. Traders can also use other technical indicators, such as moving averages and momentum indicators, to confirm the validity of the pattern.
For example, if a you identifies a triple bottom pattern on a daily chart, you may look to enter a long position when the price breaks above the resistance level on a 4-hour chart. You can also use a moving average crossover as confirmation of the pattern.
How to trade Triple Bottom Pattern?
1. Identify the highs: Look for two consecutive highs and draw a trend line touching the both highs, It will act as resistance also referred as Neckline for them at approximately the same price level, with the middle bottom being the lowest.
2. Confirm the pattern: Confirm the pattern by looking for high trading volume during the formation of the pattern, and by waiting for the price to break above the resistance level created by the pattern.
3. Enter the trade: Enter a long position from the next candle which Breaks the price above the resistance level OR Neckline. You Must use a stop loss below the low of the candle previous to the breaking candle.
NOTE: Risk Reward Ration-The difference between the point of Buying and the stoploss must be according to the 2% rule of Risk Reward Ratio. If this rule does’nt follows then font take the trade.
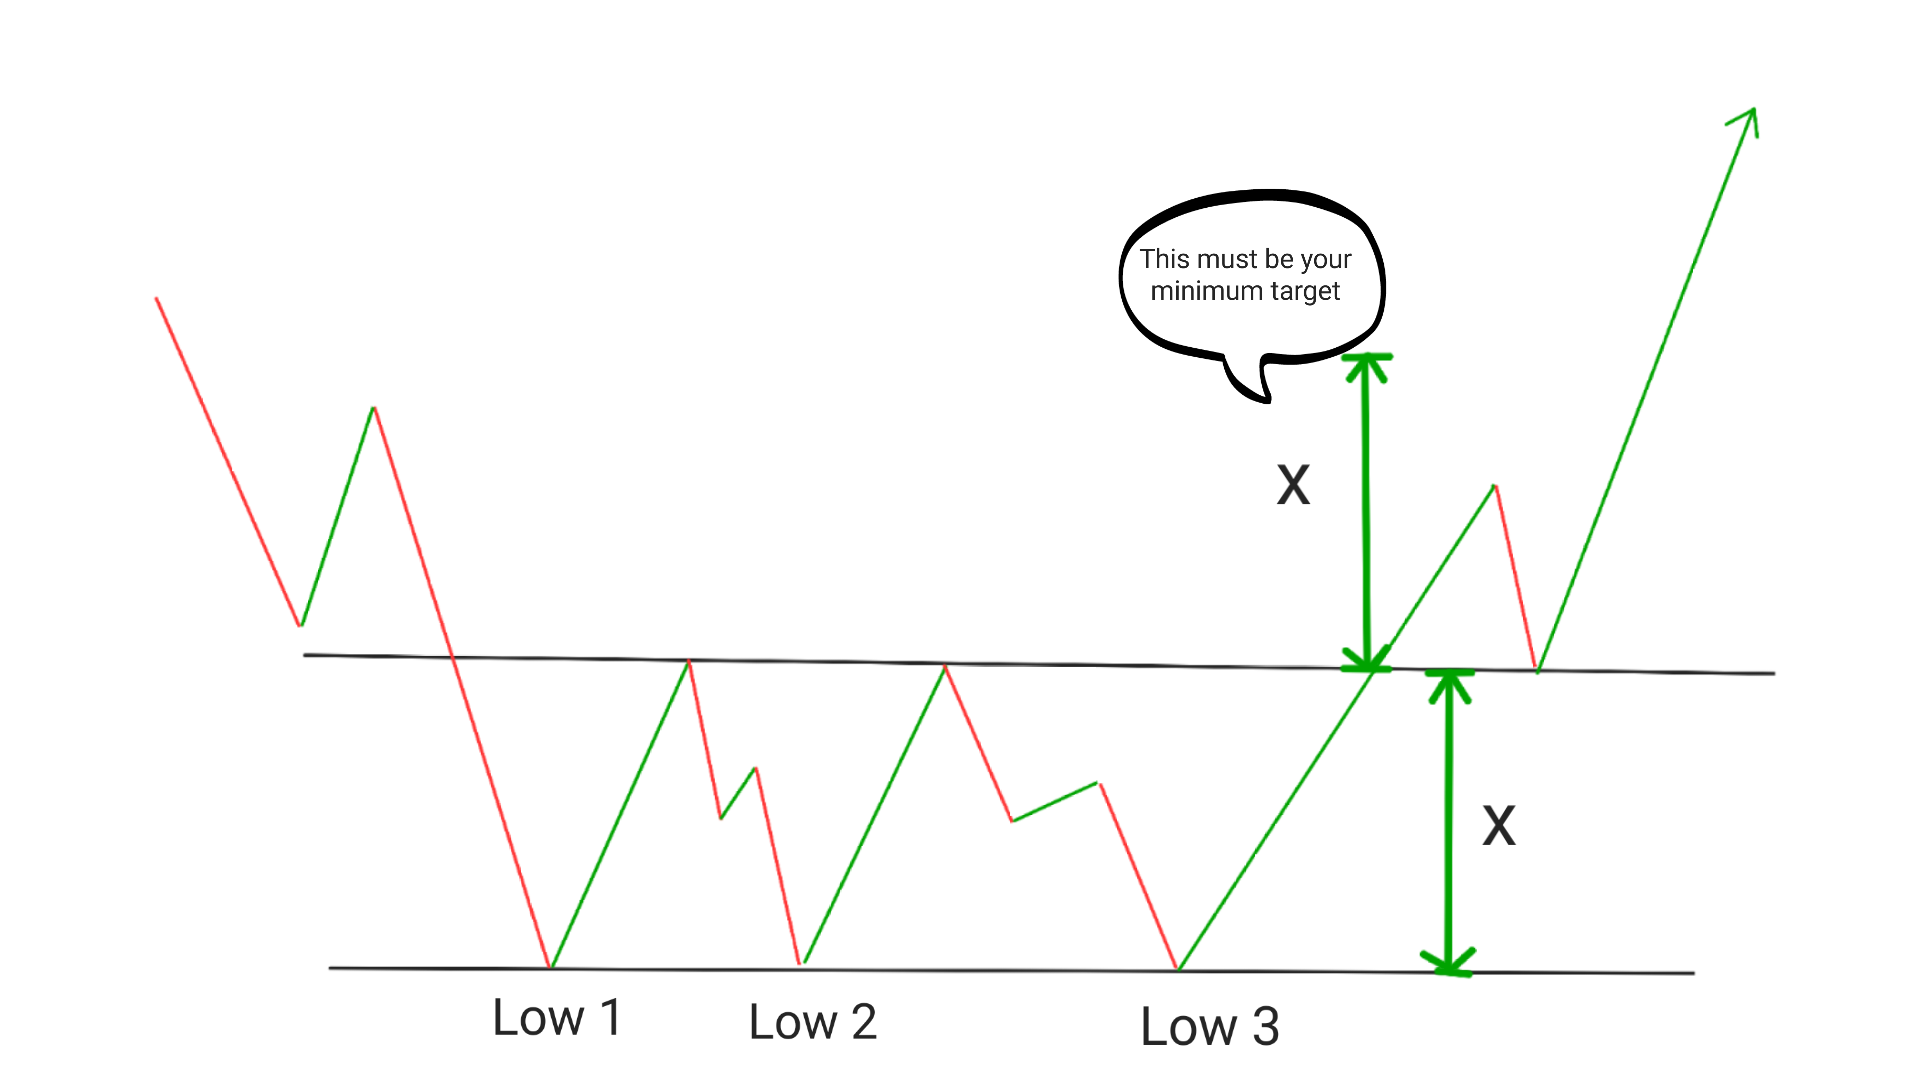
4. Set a profit target: Set a profit target based on the height of the pattern. You can calculate this by measuring the distance between the resistance level(Neckline) and the lowest point of the pattern, and adding this distance to the breakout point.
5. Monitor the trade: Monitor the trade closely to ensure that it is going according to plan. If the price starts to fall below the support level, consider closing your position to limit your losses.
NOTE: Remember to always use proper risk management techniques when trading any pattern, and to only trade with money that you can afford to lose. By following these steps, you can potentially profit from a bullish reversal in the market.
Potential Pitfalls of the Triple Bottom Pattern:
While the triple bottom pattern can be a powerful tool for traders, there are some potential pitfalls that traders should be aware of.
False Breakouts: In some cases, the price may break above the resistance level but then quickly reverse and continue to decline. Traders should always use stop losses to limit their losses in case of a false breakout.
Market Noise: The triple bottom pattern can be difficult to identify in noisy markets where prices are constantly fluctuating. Traders should always use other technical indicators to confirm the validity of the pattern.
Conclusion
The triple bottom pattern is a powerful tool for traders to identify potential bullish reversals in the market. By understanding how it works and how to use it, traders can make profitable trades and stay ahead of the game. Facts mentioned above gives clear idea about how this pattern works? One can easily make decision by reading this blog.
Frequently Asked Questions (FAQs)
1.What is the success rate of the triple bottom pattern?
The success rate of the triple bottom pattern is nearly 90%, Which means for every 10 trades taken based on triple bottom pattern you can make profit in 9 out of those 10 trades.
2.Is a triple bottom better than a double bottom?
Yes, Both double bottom and triple bottom patterns can be effective bullish reversal patterns, but the triple bottom pattern may be considered stronger as it shows more resilience in the support level.
3.Is triple top pattern bullish?
No, a triple top pattern is bearish as it indicates that the price has failed to break through a resistance level three times.
4.Is a triple bottom good?
A triple bottom pattern can be good for traders who are looking for a bullish reversal signal. However, it is important to remember that no pattern is foolproof and traders should always use proper risk management techniques.
5.Are triple bottom bullish?
Yes, a triple bottom pattern is generally considered a bullish reversal pattern as it indicates that the price has found strong support at a particular level and is likely to move higher.
