
Evening Star Pattern
Are you looking for a powerful tool to help you identify potential trend reversals in the stock market? Look no further than the Evening Star candlestick pattern! This popular technical analysis tool is a three-candle formation that can signal a potential shift from bullish to bearish sentiment.

What is Evening Star Candlestick Pattern?
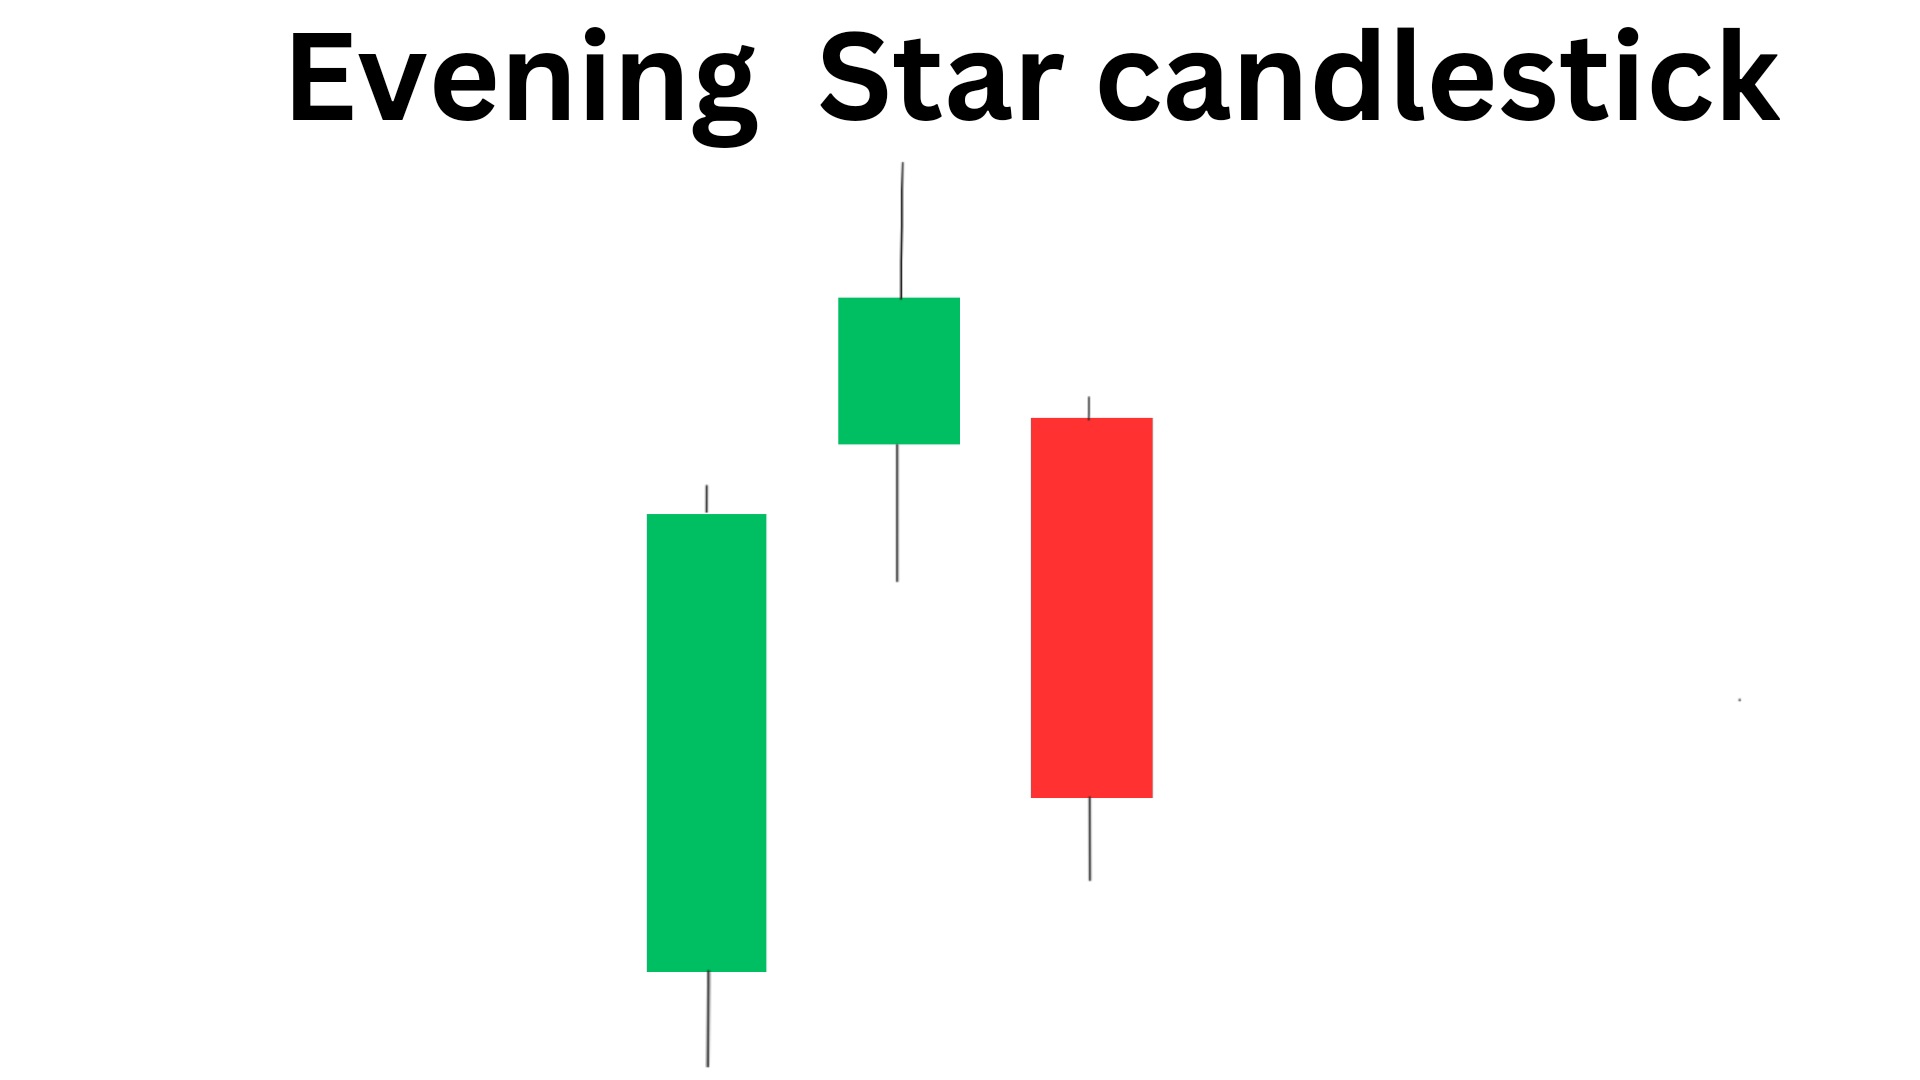
The evening star pattern is a three candlestick bearish reversal pattern that appears at the end of an uptrend.
- The first candle in the pattern is a long bullish candle,
- followed by a small bullish or bearish (green or red) candle with a gap up or down from the previous candle.
- The third candle is a long bearish candle that closes below the midpoint of the first candle.
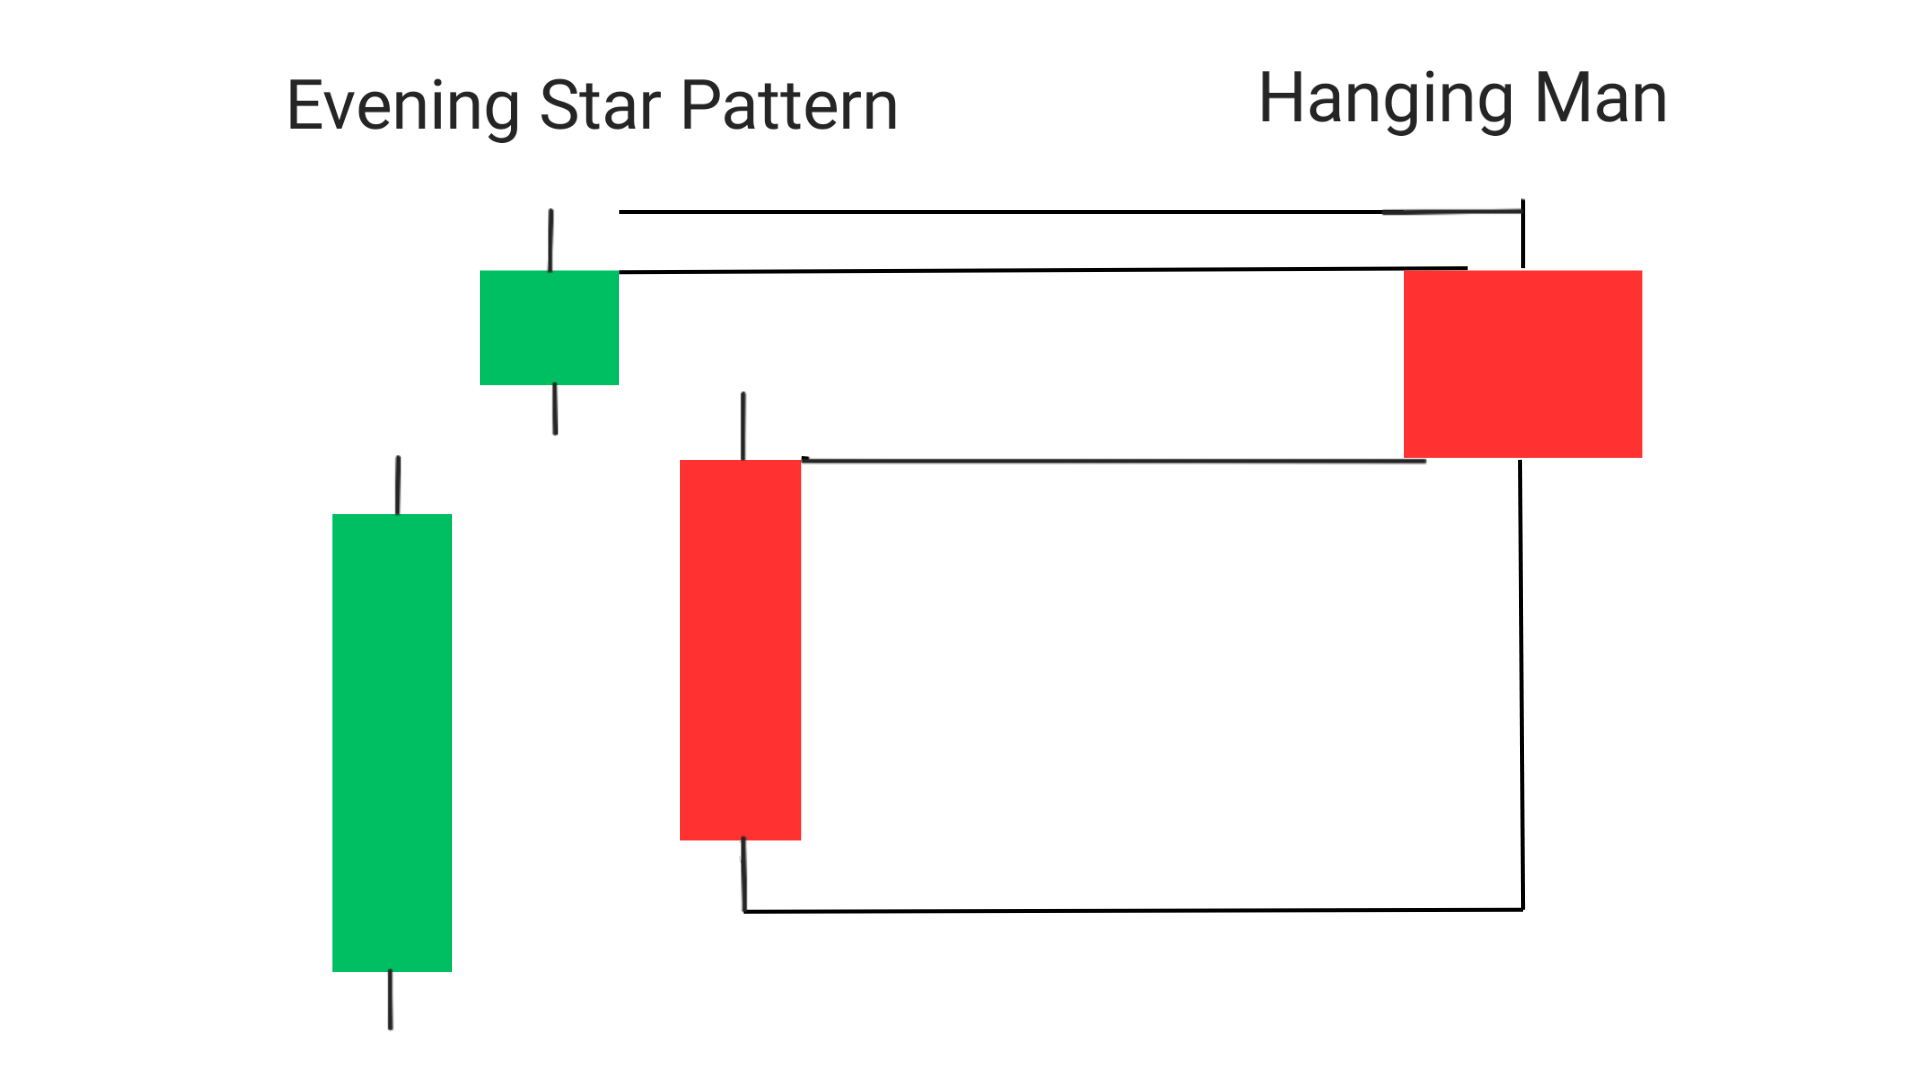
The evening star pattern Is similar to the morning star pattern, which appears at the end of a downtrend. However, the morning star pattern signals a potential trend reversal to the upside, while the evening star pattern signals a potential trend reversal to the downside. Evening star pattern is equivalent to Hanging Man candlestick pattern.
Here is how you can easily identify evening star pattern as hanging man
How to Identify the Evening Star Candlestick Pattern?
Identifying the evening star pattern is relatively easy. You need to look for three candles in a row that meet the following criteria:
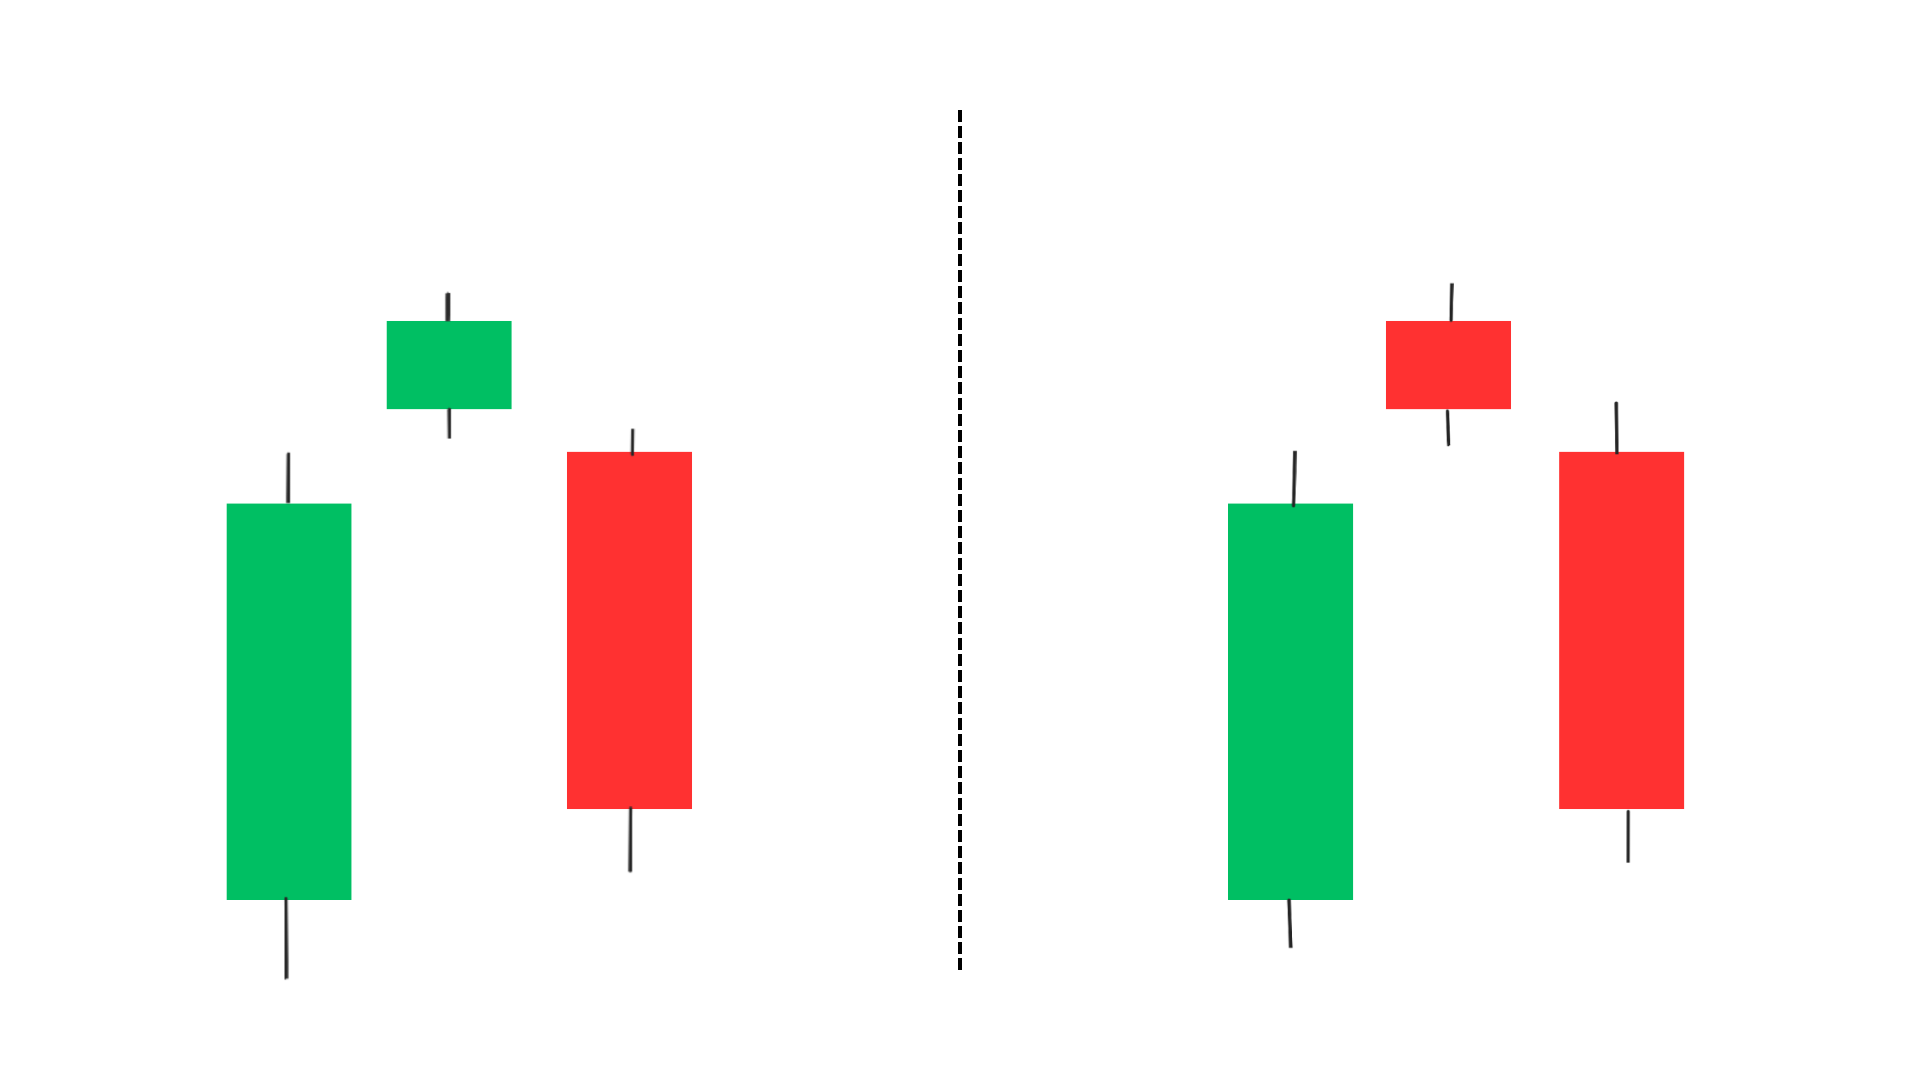
1. The first candle should be a long bullish candle.
2. The second candle should be a small bullish or bearish candle with a gap up or down from the previous candle.
3. The third candle is a long bearish candle that closes below the midpoint of the first candle.
If you see these three candles in a row, then you have identified an evening star pattern.
bestseller mastermind book to learn trading from scratch along with examples is here
What Does the Evening Star Candlestick Pattern tells you?
The evening star pattern is a bearish reversal pattern that signals a potential trend reversal to the downside. It occurs when buyers are losing control of the market, and sellers are starting to take over.
The first candle in the pattern represents a strong bullish move, with buyers in control of the market. However, the small candle that follows indicates indecision, with neither buyers nor sellers in control. The third candle represents a strong bearish move, with sellers taking control of the market and pushing prices lower.
NOTE: The evening star pattern Is a warning sign to traders that the trend may be reversing, and it may be time to consider shorting the market or closing out long positions.
How to Trade the Evening Star Pattern?
The evening star is a bearish reversal pattern that occurs at the end of an uptrend. It consists of three candles: a large bullish candle, followed by a small indecisive candle, and then a large bearish candle. Here are the entry, exit, and stop-loss strategies for trading the evening star pattern:
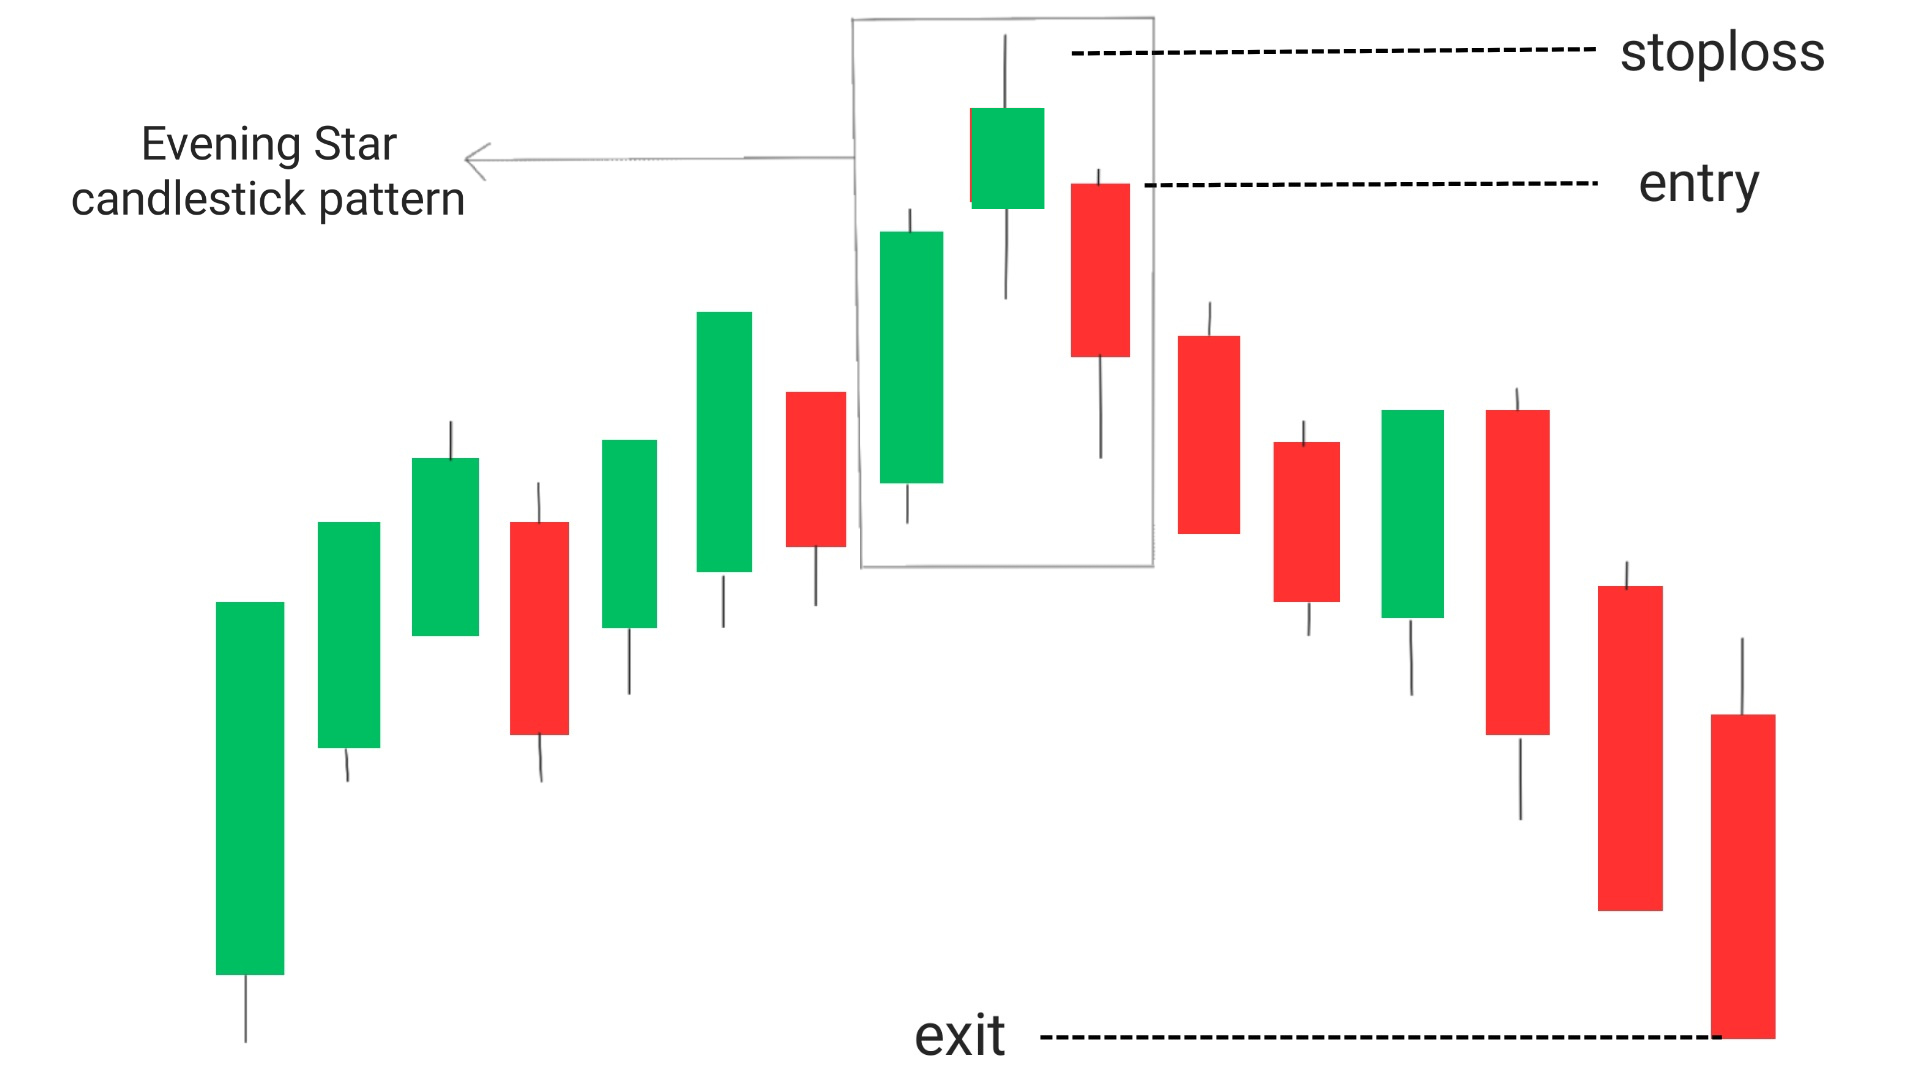
1.Entry:
- Wait for the evening star pattern to form at the end of an uptrend
Enter a short position once the bearish candle closes below the low of the indecisive candle
2.Exit:
- Take profits at a predetermined target level or when the trend shows signs of reversing
- Alternatively, use a trailing stop to capture further downside potential
- OR, Exit the trade if the price has reached a significant support level, where price has already taken support previously.
3.Stop-loss:
- Place a stop-loss above the high of the bullish candle to limit potential losses
- Adjust the stop-loss as the trade progresses to protect profits and minimize risk
Apply the steps mentioned below in order to take trading decision more precisely,
1. Wait for confirmation: Before entering a trade based on the evening star pattern, wait for confirmation from other technical indicators. Look for additional bearish signals, such as a bearish divergence or a break of key support levels.
2. Set your stop loss: To limit potential losses if the trade goes against you, set your stop loss just above the high of the first candle in the pattern.
3. Set your profit target: To lock in profits, set your profit target at a predetermined level or based on the appearance of another candlestick pattern that suggests a trend reversal.
4. Use trailing stops: As the trade moves in your favor, use trailing stops to lock in profits and minimize potential losses.
Conclusion
The evening star candlestick pattern is a popular reversal pattern that can signal a potential trend reversal to the downside. It’s important to wait for confirmation from other technical indicators before entering a trade based on this pattern and to set your stop loss and profit target accordingly. With patience and careful analysis, you can use the evening star pattern to improve your trading strategy and increase your chances of success in the market.
Difference between Shooting star and Evening Star
| Shooting Star | Evening Star |
|---|---|
| It is a single candlestick bearish reversal pattern. | It is a three candlestick bearish reversal pattern. |
| It has a small body with a long upper wick. | It consists three candles one is long bullish candle yhen a small candle and at last it has a long bearish candle. |
Difference Between Morning Star and Evening star pattern
The Morning Star and Evening Star patterns are both candlestick patterns that indicate a potential reversal in price direction. The difference between the two is the direction of the trend.
1.Morning Star Pattern:
- Occurs at the end of a dwntrend
- Consists of three candles: a long bearish candle, a short candle with a small body that gaps down, and a long bullish candle
- The small candle represents indecision in the market and can be a sign of a potential reversal
- The bullish candle confirms the reversal and indicates that buyers have taken control
2.Evening Star Pattern:
- Occurs at the end of an uptrend
- Consists of three candles: a long bullish candle, a short candle with a small body that gaps up, and a long bearish candle
- The small candle represents indecision in the market and can be a sign of a potential reversal
- The bearish candle confirms the reversal and indicates that sellers have taken control
Types of evening star candlestick
There are three types of Evening Star candlestick patterns:
1. Bearish Evening Star: This is the most common type of Evening Star pattern and it occurs during an uptrend. The first candle is a long white candle, followed by a small-bodied candle that gaps up, and then a long black candle that gaps down. The black candle should close below the midpoint of the first white candle.
2. Bullish Evening Star: This pattern occurs during a downtrend. The first candle is a long black candle, followed by a small-bodied candle that gaps down, and then a long white candle that gaps up. The white candle should close above the midpoint of the first black candle.
3. Doji Evening Star: This pattern occurs when the second candle is a doji, which means it has a small body and opens and closes at the same price level. The doji can be bullish or bearish, depending on its position in the pattern. If it appears after a long white candle, it can be a bearish signal, and if it appears after a long black candle, it can be a bullish signal.
Bearish evening star pattern
This is the most common type of Evening Star pattern and it occurs during an uptrend. The first candle is a long white candle, followed by a small-bodied candle that gaps up, and then a long black candle that gaps down. The black candle should close below the midpoint of the first white candle.
evening star pattern target
The target for the Evening Star pattern can vary depending on the specific market and timeframe being analyzed. However, generally, the target for the pattern is the recent support level or a previous low.
- Take profits at a predetermined target level or when the trend shows signs of reversing
- Alternatively, use a trailing stop to capture further downside potential
- OR, Exit the trade if the price has reached a significant support level, where price has already taken support previously.
Frequently Asked Questions (FAQs)
1.How accurate is the Evening Star candlestick?
The accuracy of the Evening Star candlestick pattern is around 70%, which means for every 5 trades taken , there is probability that you will make profit in 3 to 4 out of those 5 trades.
2.What is the difference between a shooting star and an evening star candle?
A shooting star candlestick pattern occurs when a small-bodied candle with a long upper wick appears after an uptrend, indicating potential selling pressure. An evening star pattern, on the other hand, consists of three candles: a large bullish candle, a small-bodied candle with a gap up, and a large bearish candle, indicating a potential trend reversal.
3.What is a doji star?
A doji star is a candlestick pattern that occurs when the opening and closing prices are almost the same, resulting in a small-bodied candle with long upper and lower wicks. This pattern indicates indecision in the market and can signal a potential trend reversal.
4.Is Evening Star bullish or bearish?
The Evening Star candlestick pattern is bearish, indicating a potential trend reversal from an uptrend to a downtrend
5.Is a morning star bullish or bearish?
Morning Star is bullish. It is formed at the end of the downtrend and it has the potential to convert uptrend into downtrend.
