
How To Trade Rounding Bottom Chart Pattern? example with 5FAQs
Are you tired of missing out on potential buying opportunities in the market? Look no further than the rounding bottom chart pattern, a bullish reversal pattern that can help you identify when an asset is bottoming out and ready to reverse course. With its distinctive U-shape curve, the rounding bottom is a powerful tool for traders looking to capitalize on potential uptrends and improve their chances of success in the markets.

What is a Rounding Bottom?
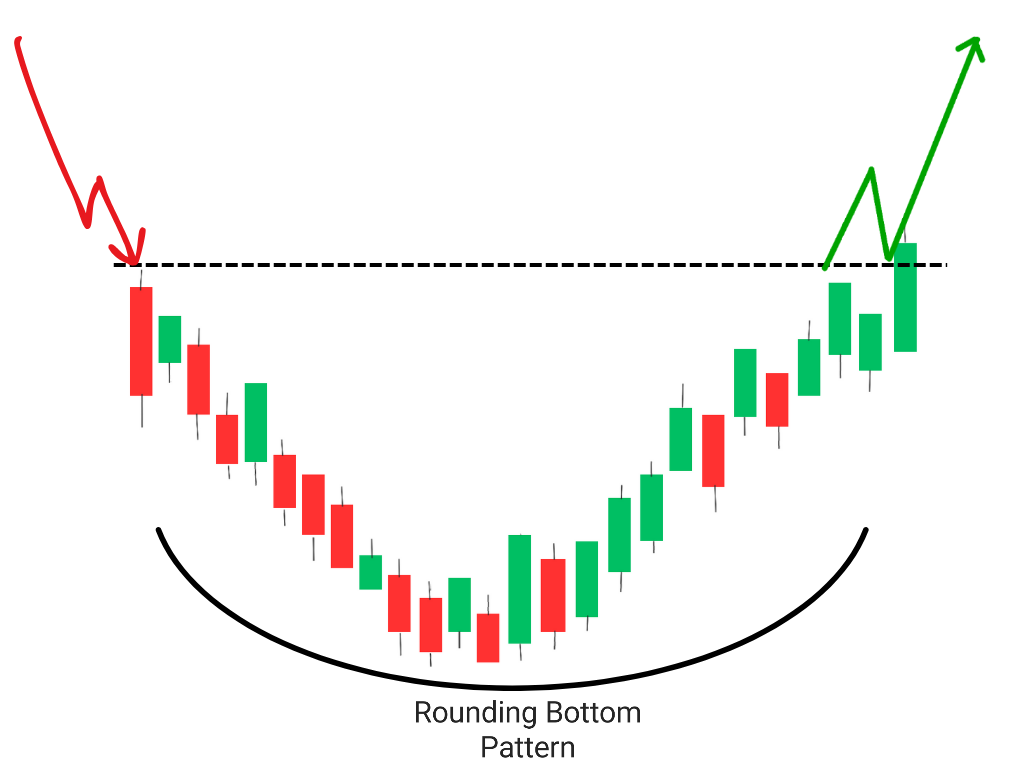
A rounding bottom is a bullish reversal chart pattern that forms after a long downtrend. It is characterized by a series of lower lows followed by a gradual increase in prices, forming a rounded bottom ‘U’ shape on the chart. Thos pattern is also known as ‘Saucer Bottom’ The pattern is confirmed when prices break above the resistance level formed by the highest point of the rounded bottom.
Why is it Important for Traders?
The rounding bottom pattern is a powerful technical analysis chart pattern that signals a potential trend reversal from bearish to bullish. Traders can use this pattern to identify buying opportunities and enter trades at the beginning of an uptrend. By identifying the rounding bottom pattern, traders can potentially profit from the market’s upward movement.This pattern takes year to form on chart.
Note: Trader must keep this point in their mind that this pattern is mainly preferred for long term investment only and there are very little chances that rounding bottom chart pattern will work effectively during Intraday or for swing traders.
Top Bestseller mastermind book to learn trading from scratch along with examples click here.
How to Identify a Rounding Bottom Chart Pattern?
To identify a rounding bottom stock pattern, traders should look for a series of lower lows followed by a gradual increase in prices forming a rounded bottom shape. Rounding bottom formation:- The pattern is confirmed when prices break above the resistance level formed by the highest point of the rounded bottom.
Traders can also use technical indicators to confirm the rounding bottom pattern. For example, traders can use the Relative Strength Index (RSI) to confirm that the stock or asset is oversold and ready for a rebound. The Moving Average Convergence Divergence (MACD) indicator can also be used to confirm that there is momentum building in the stock or asset.
How to Trade Using the Rounding Bottom Pattern?
Traders can trade using the rounding bottom pattern by entering a long position especially for long term investment when prices break above the resistance level. The stop loss should be placed below the lowest point of the rounded bottom. Traders can take profit at the next resistance level or use a trailing stop loss to capture more profits.
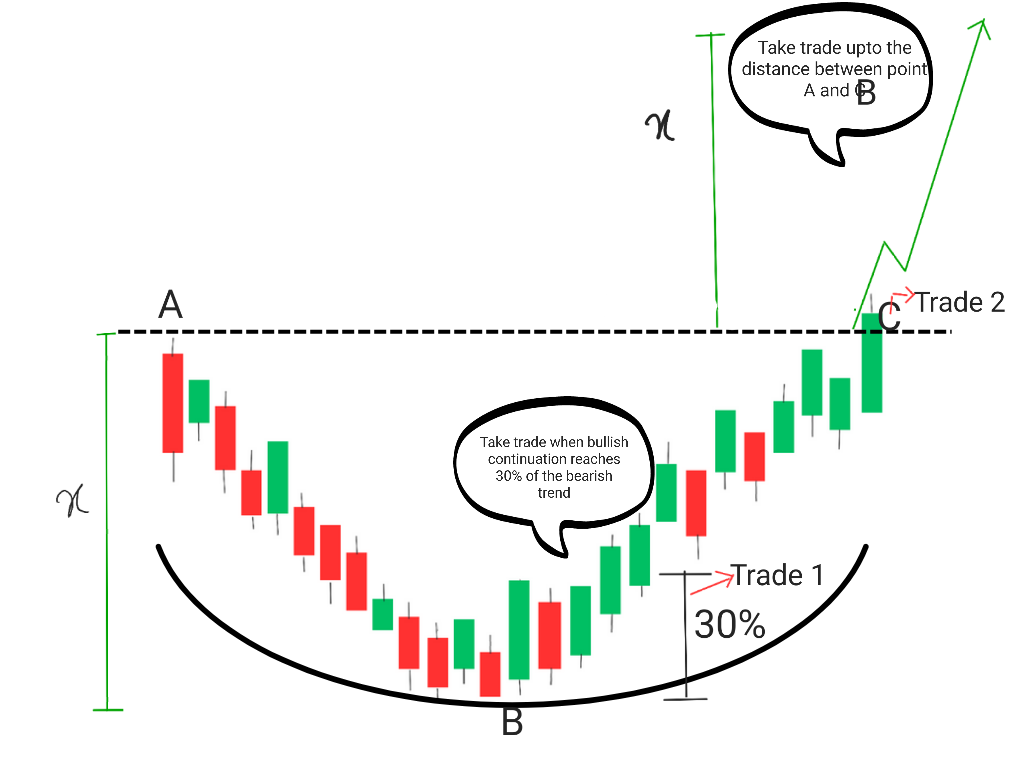
TRADE 1
Entry: Enter the trade as soon as the sideways maket discontinues and the price started rising and has covered almost 30% of the bearish movement, This is low risky and there are high chances that you will be able to make huge profits.
Exit: Exit the trade when the prices teaches the point C given in the above chart, That point works as the resistance as the price gets rejection there.
TRADE 2
Entry: When a candle crosses the resistance or the point B, Tke another trade and expect a target whose distance will be equal to the difference in the distance between the point A and B, but remember this a high risk trade and trade according to price action.
Exit: Exit the trade when it reaches the distance equal to the distance between the hisher and lower points of the rounding bottom chart pattern i.e. A and B.
Here are general steps to consider when trading the rounding bottom chart pattern:
1. Identify the pattern: First of all look for a U-shaped pattern in the price chart of an asset. The pattern should have a clear low point, followed by a gradual increase in price, and then a breakout above the resistance level.
2. Confirm the pattern: Use other technical indicators such as volume, moving averages, and momentum oscillators to confirm the validity of the rounding bottom pattern.
3. Enter the trade: Once the pattern is confirmed, enter a long position (buy) at the breakout point above the resistance level.
4. Set stop-loss: Place a stop-loss order below the low point of the rounding bottom pattern to limit potential losses if the trade goes against you.
5. Set profit target: Calculate the distance between the lowest point of the rounding bottom pattern and the highest point of the curve, and then add that distance to the breakout point to determine your profit target.
6. Monitor the trade: Keep an eye on the price action and adjust your stop-loss and profit target as necessary.
Conclusion
The rounding bottom is a powerful technical analysis tool that can help traders identify potential bullish reversals and enter trades at the beginning of an uptrend. Traders should always remember to use proper risk management techniques and follow their trading plan when trading using this pattern.
To identify the rounding bottom pattern, traders should look for a series of lower lows followed by a gradual increase in prices forming a rounded bottom shape. The pattern is confirmed when prices break above the resistance level formed by the highest point of the rounded bottom.
Rounding Bottom Vs Cup and Handle
Rounding bottom and cup and handle are two different chart patterns used in technical analysis to identify potential bullish trends in the market.
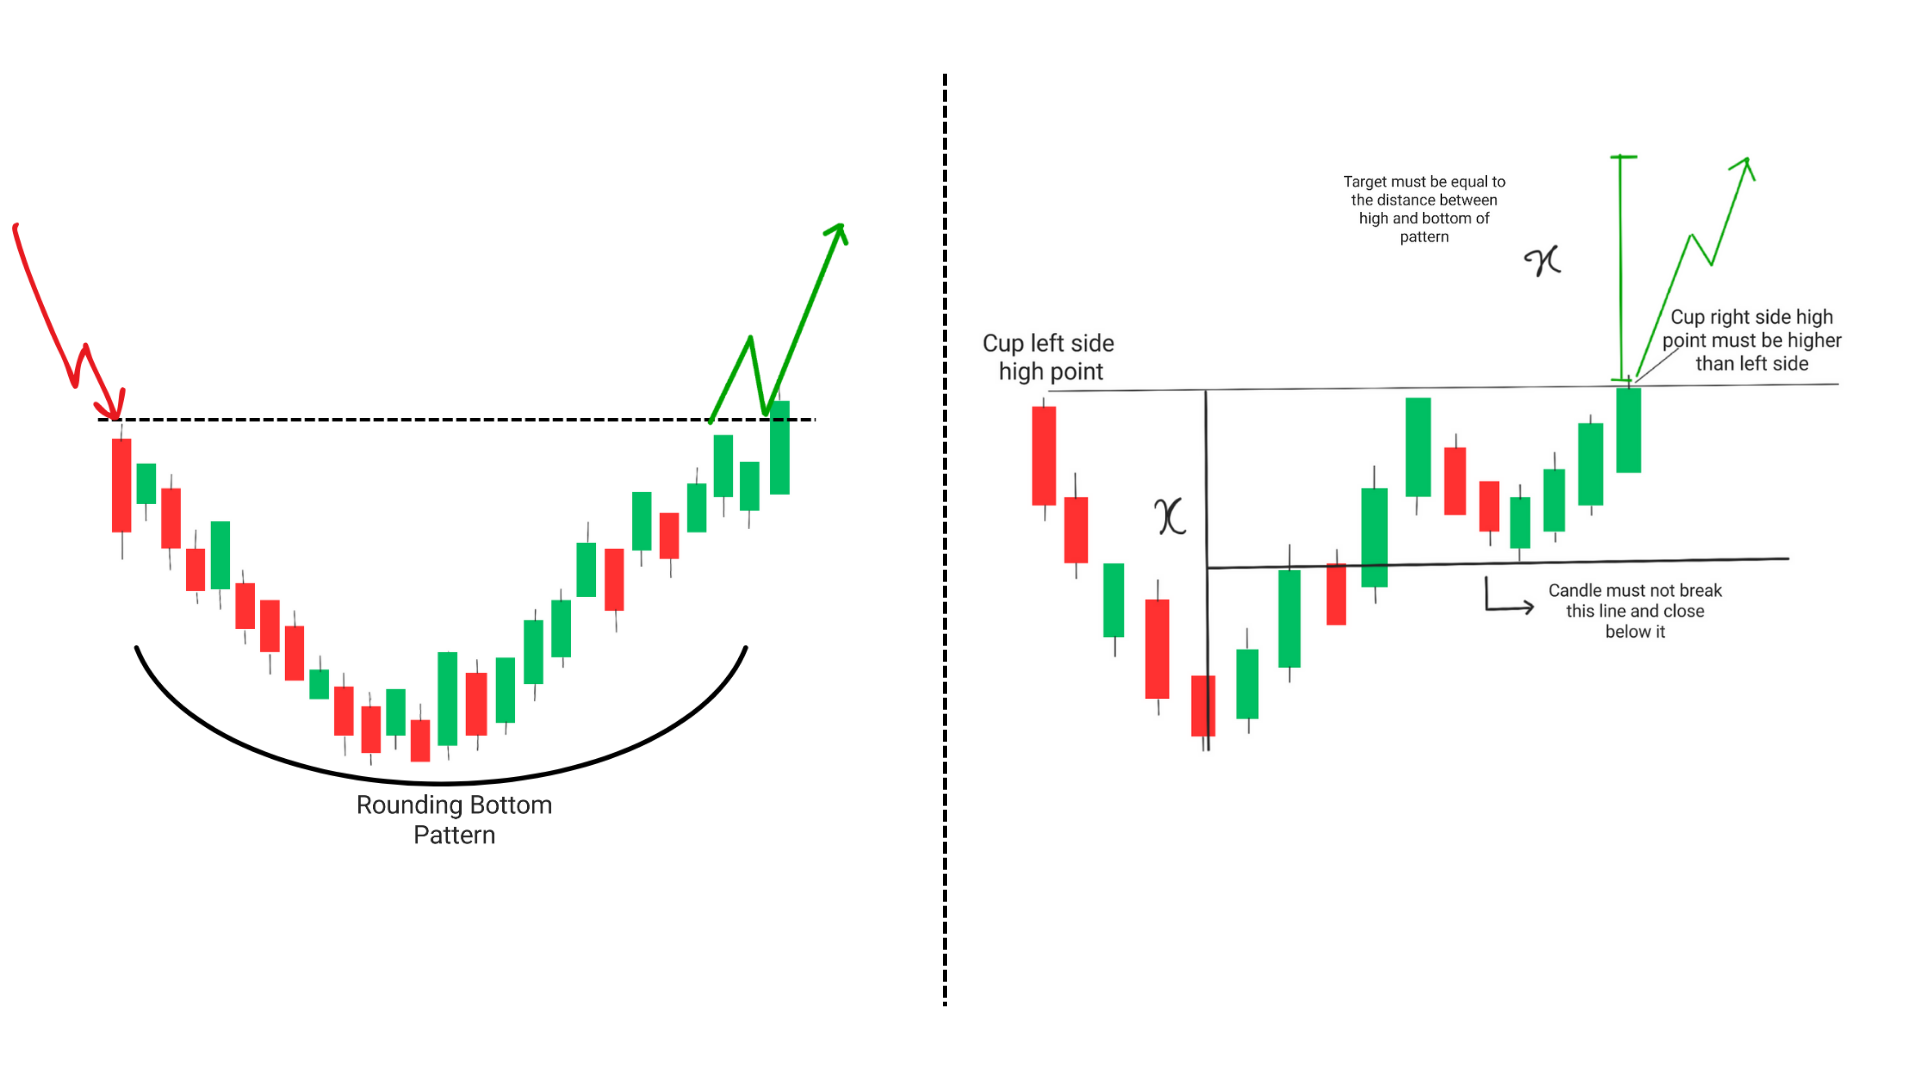

A rounding bottom pattern is a longer-term reversal pattern that is formed by a gradual decline in the price of an asset followed by a gradual rise in price. The pattern resembles a “U” shape or a rounded bottom, hence the name. This pattern is bullish because it indicates that the selling pressure has been exhausted and buyers are gradually taking control of the market.
On the other hand, a cup and handle pattern is a short term continuation pattern that is formed by a sharp rise in price followed by a period of consolidation, forming a “U” shape or cup. This is followed by a small pullback, forming a handle of V shape. This pattern is also considered bullish because it indicates that the buyers are in control of the market and are likely to continue pushing the price higher.
In summary, while both patterns have a similar shape, the rounding bottom is a longer-term reversal pattern, while the cup and handle is a shorter-term continuation pattern.
Rounding Top and Rounding Bottom
Rounding top and rounding bottom are chart patterns that indicate a potential trend reversal.
Rounding top is a chart pattern that looks like a dome or an upside-down “U”. It occurs when the price of an asset rises to a certain level, then falls back down to a support level, and then rises again but fails to reach the previous high. The pattern suggests that the uptrend is losing momentum and the bears are starting to take control.
Rounding bottom, on the other hand, is a chart pattern that looks like an inverted dome or a “U”. It occurs when the price of an asset falls to a certain level, then rises back up to a resistance level, and then falls again but fails to reach the previous low. The pattern suggests that the downtrend is losing momentum and the bulls are starting to take control.
Frequently Asked Questions (FAQs)
1.What does rounding bottom mean?
Rounding bottom is a technical analysis bullish chart pattern that occurs when the price of an asset forms a U-shaped pattern, indicating a possible trend reversal from a downtrend to an uptrend.
2.What is the rounding bottom in psychology?
In psychology, rounding bottom refers to a pattern in which a person’s mood or emotional state gradually improves after reaching a low point.
3.How do you calculate rounding bottom target?
To calculate the rounding bottom target, traders measure the distance between the lowest point of the rounding bottom and the highest point of the curve, and then add that distance to the breakout point of the pattern.
4.What is rounding top and rounding bottom?
Rounding top is the opposite of rounding bottom, in which the price of an asset forms an inverted U-shaped pattern, indicating a possible trend reversal from an uptrend to a downtrend.
5.Is rounding bottom pattern bullish?
Yes, the rounding bottom pattern is bullish as it suggests that the price has reached a bottom and is likely to reverse its trend and move higher.
