Upside Tasuki Gap: 5 FAQs
Candlestick patterns are athe most essential tool for traders to analyze the market trends and make informed decisions. One such pattern is the Upside Tasuki Gap, which is a bullish continuation pattern. In this blog, we will discuss the Upside Tasuki Gap candlestick pattern, its formation, and how it can be used to trade in the market.
What is the Upside Tasuki Gap Candlestick Pattern?
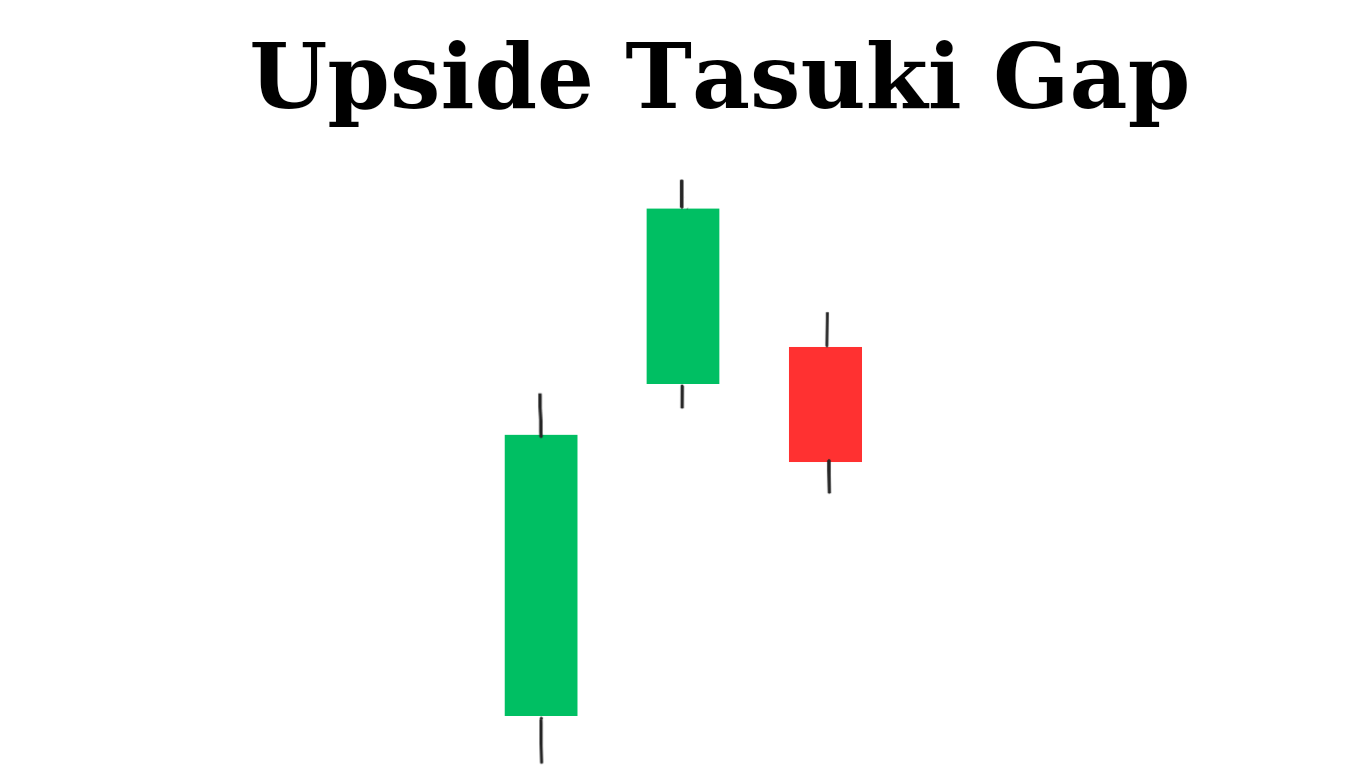
The Upside Tasuki Gap candlestick pattern is a three candlestick bullish continuation pattern that appears during an uptrend in the market. It consists of three candles, with the first two being long bullish candles, and the third one being a bearish candle with a gap up opening. The bearish candle should close within the body of the second bullish candle.
Formation of the Upside Tasuki Gap Candlestick Pattern:
The Upside Tasuki Gap candlestick pattern is a three candlestick bullish continuation pattern which is formed when the market is in an uptrend, and there is a gap up opening on the third day after two consecutive bullish candles. The gap up opening indicates that the buying pressure is still strong, and the trend is likely to continue. The bearish candle that follows the gap up opening should ideally close within the body of the second bullish candle, indicating that the bears have failed to push the price down.
Interpretation of the Upside Tasuki Gap Candlestick Pattern
The Upside Tasuki Gap candlestick pattern is a bullish continuation pattern, which indicates that the uptrend is likely to continue. The gap up opening on the third day indicates that the buying pressure is still strong, and the bears(Sellers) have failed to push the price down. The bearish candle that follows should ideally close within the body of the second bullish candle, indicating that the bears have failed to gain control of the market. It is confirmed that price will move upward only if candle next to this pattern closes above the high of this candlestick pattern.
Top Bestseller mastermind book to learn trading from scratch along with examples click here.
How To Trade Upside Tasuki Gap Candlestick Pattern?

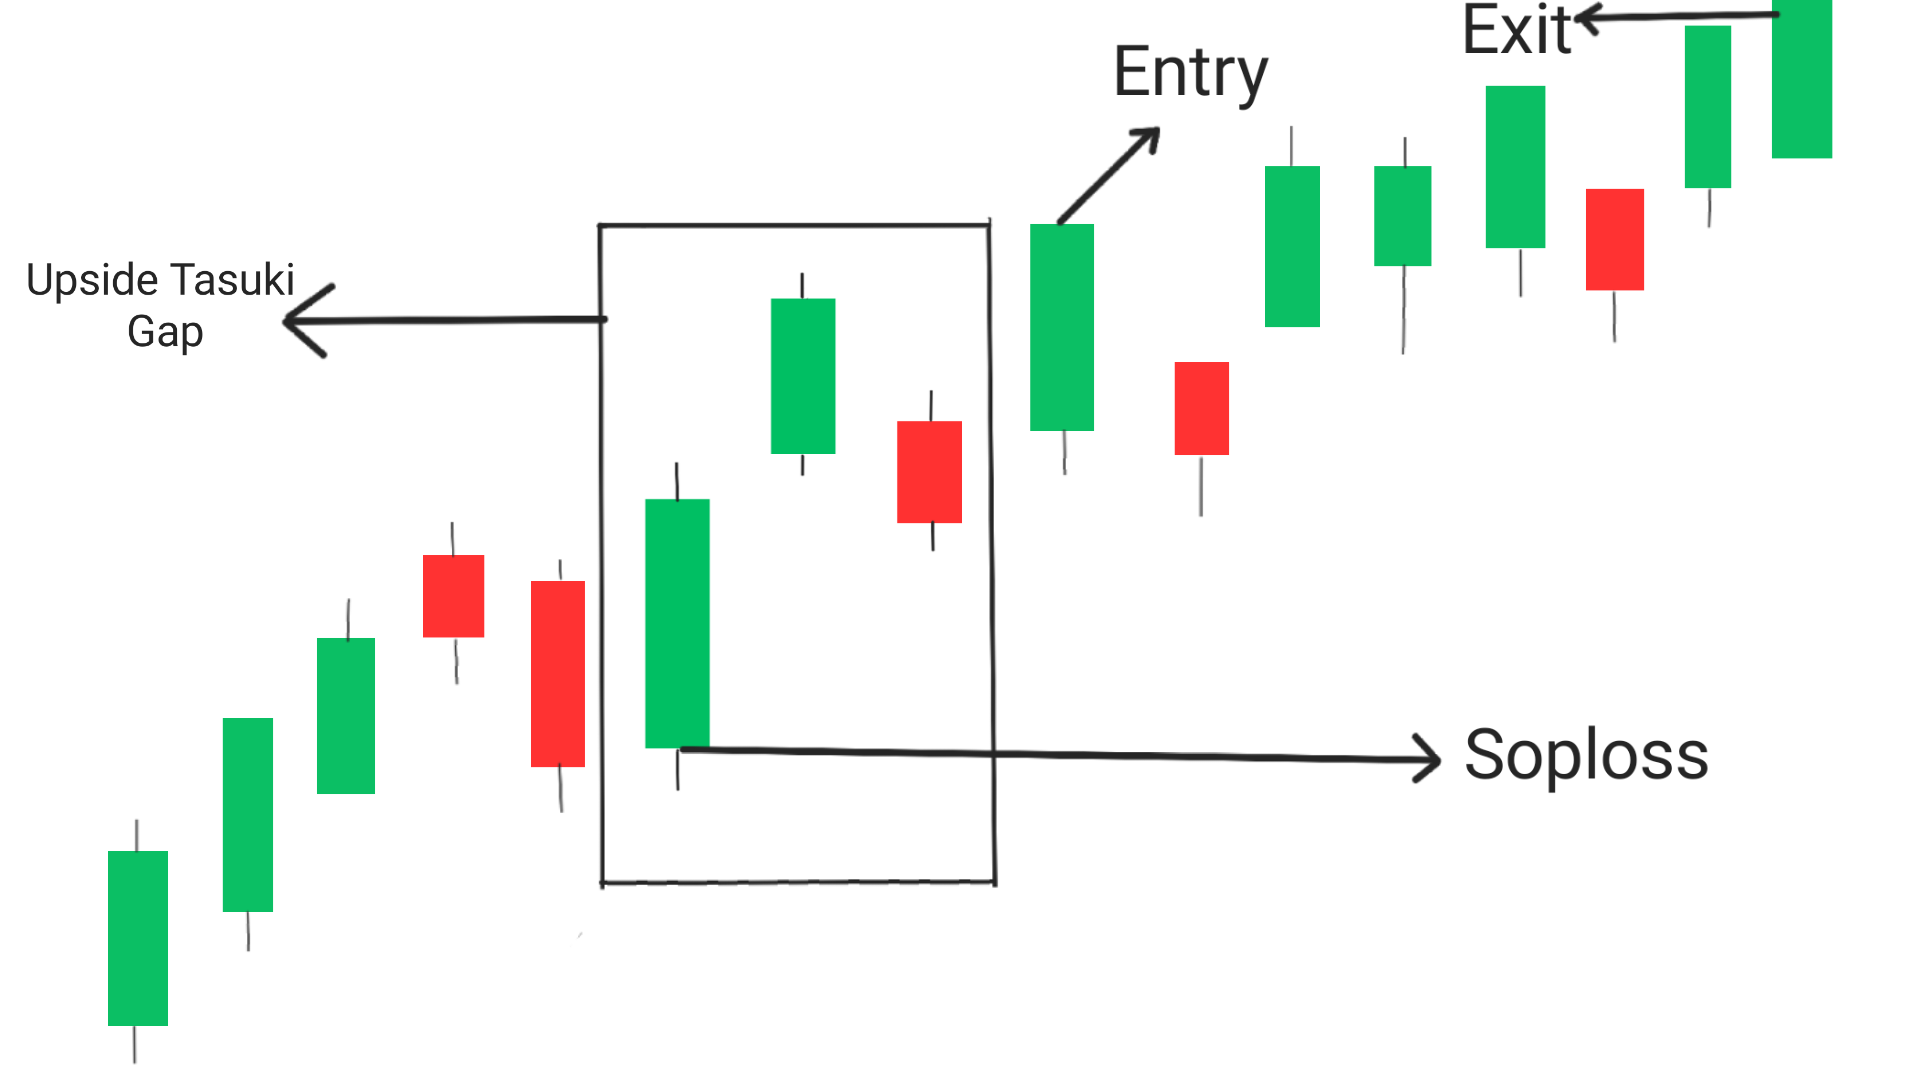
Traders can use the Upside Tasuki Gap candlestick pattern to enter long positions in the market. The pattern indicates that the uptrend is likely to continue, and traders can place a buy order above the high of the third candle. Traders can place a stop loss below the low of the second bullish candle. The target price can be set by using a trailing stop loss or by identifying key resistance levels.
Entry: The best possible entry point while using upside tasuki gap is when the candle next to pattern crosses the high of this pattern.
Exit: Exit the trade when you have achieved your goal or if the price has reached a significant resistance level, If you want to trade more you can look for a real breakout near resistance level, If it happens then take another trade upto new resistance level.
Stoploss: In order to minimize the risk of stoploss hitting, Stoploss must be set at the low of the candlestick pattern.
Conclusion
The Upside Tasuki Gap candlestick pattern is a bullish continuation pattern that appears during an uptrend in the market. This pattern consists of three candles, with the first two being long bullish candles, and the third one being a bearish candle with a gap up opening. The pattern indicates that the uptrend is likely to continue, and traders can use it to enter long positions in the market. However, traders should always use proper risk management techniques and should not solely rely on candlestick patterns for trading decisions.
Frequently Asked Questions (FAQs)
1.What does upside tasuki gap mean?
Upside tasuki gap is a technical analysis pattern that occurs when a stock opens higher than the previous day’s high, but then trades lower and closes near the previous day’s close.
2.What is the bullish upside gap?
Bullish upside gap is a type of gap that occurs when a stock opens higher than the previous day’s high and continues to trade higher throughout the day.
3.What is down side tasuki gap?
Downside tasuki gap is a technical analysis pattern that occurs when a stock opens lower than the previous day’s low, but then trades higher and closes near the previous day’s close.
4.Is up gap bullish or bearish?
An up gap is bullish because as it indicates that buyers are willing to pay a higher price for the stock.
5.What is the abandoned baby pattern?
The abandoned baby pattern is a technical analysis pattern that consists of a doji candlestick followed by a gap and a long candlestick in the opposite direction. It is considered a reversal pattern and can indicate a change in trend from bearish to bullish or vice versa.