Is Symmetrical Triangle Pattern bullish or bearish? 5 FAQs
When it comes to technical analysis in trading, the symmetrical triangle pattern is a powerful tool that can help traders identify potential price movements and make informed decisions. In this blog post, we will explore what the symmetrical triangle pattern is, how it is formed, and how traders can use it to their advantage.

What is a Symmetrical Triangle Pattern?
A symmetrical triangle pattern is a continuation chart pattern that forms when the price of an asset consolidates within a narrowing range. This pattern is characterized by two converging trendlines – one connecting a series of lower highs and the other connecting a series of higher lows. The symmetrical triangle pattern typically signals indecision in the market as buyers and sellers are in a state of equilibrium.
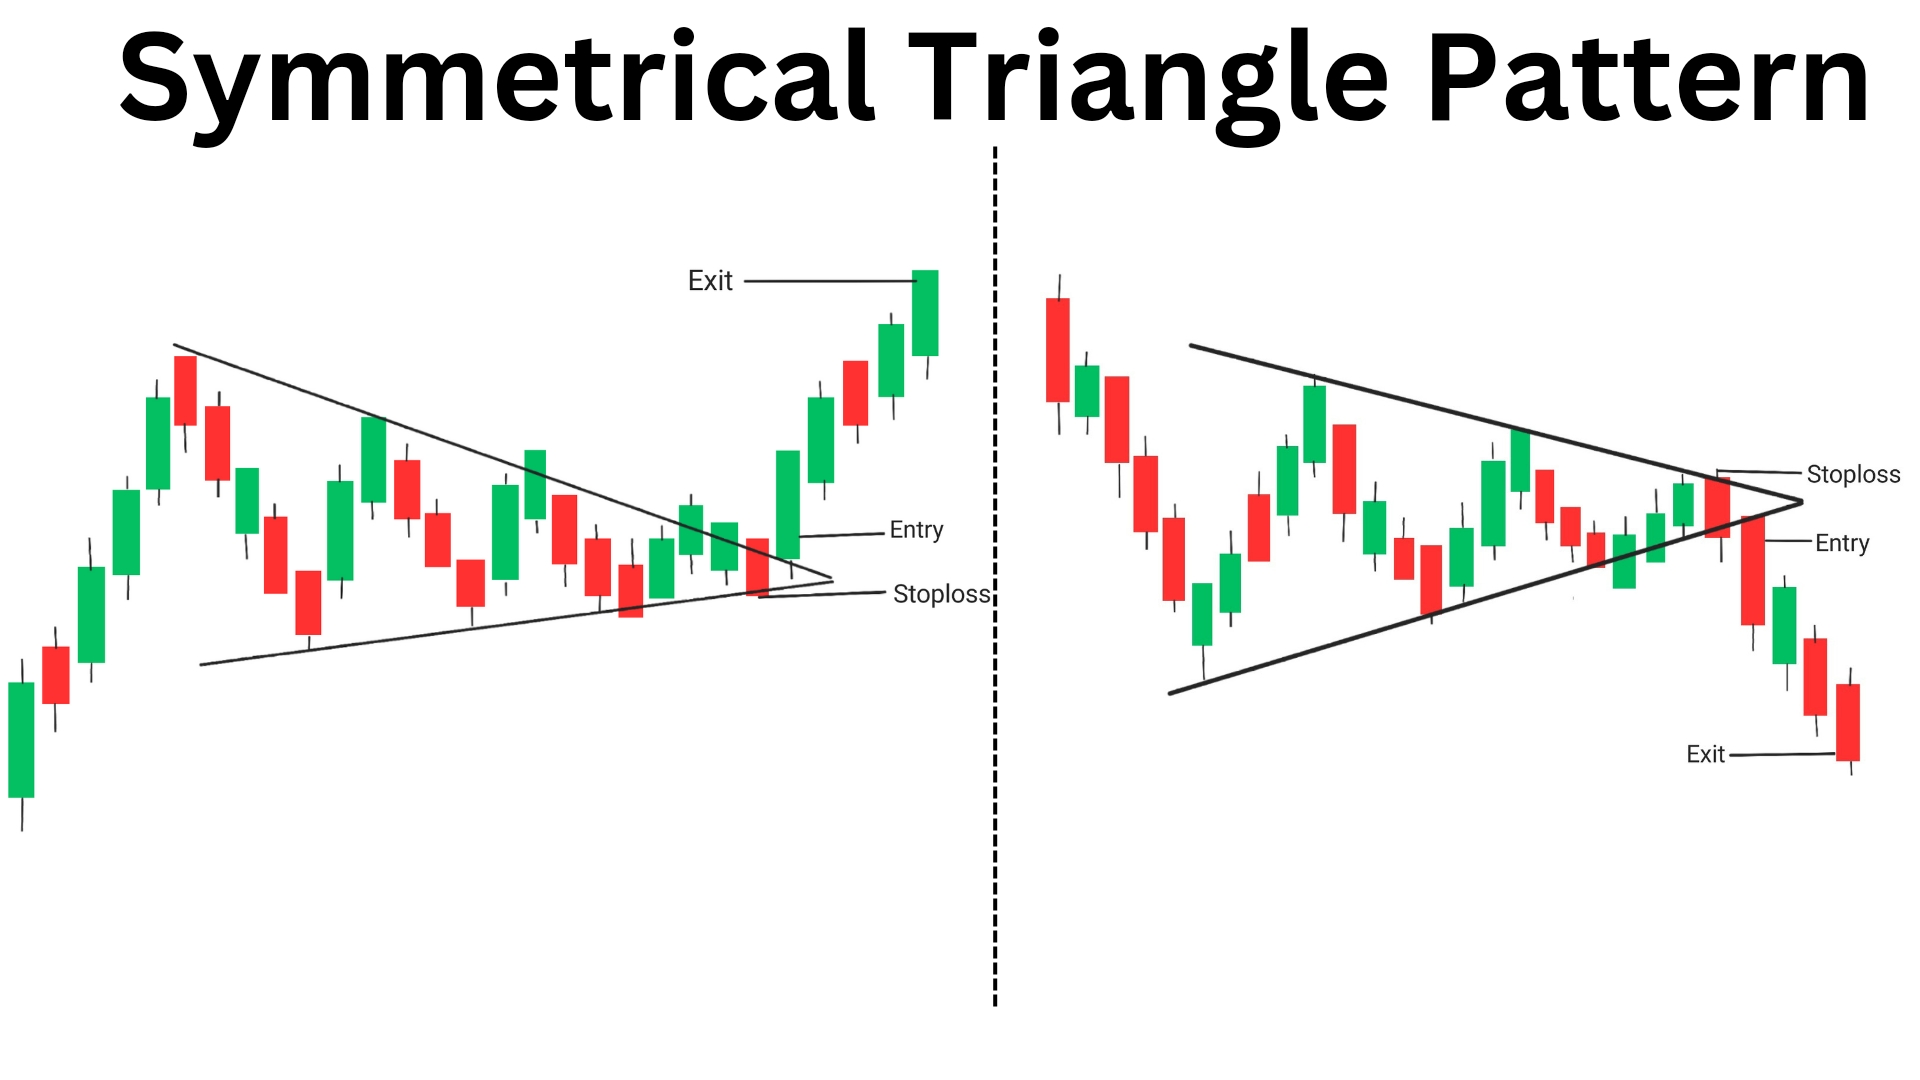
This pattern is of two types: (i) Bullish symmetrical Triangle and (ii) Bearish symmetrical triangle
(i) Bullish Symmetrical Triangle pattern
Formation: In a bullish symmetrical triangle pattern, the price action forms a triangle with a flat top (resistance line) and a rising bottom (support line).
Implications: This pattern typically occurs after an uptrend, signaling a period of consolidation and indecision. A breakout above the upper trendline (resistance) is considered a bullish signal, indicating a potential continuation of the prior uptrend.
Volume: Ideally, the breakout should be accompanied by above-average volume to confirm the strength of the bullish move.
Price Target: Traders often project a price target by measuring the height of the triangle at its widest point and adding that distance to the breakout point.
(ii)Bearish Symmetrical Triangle Pattern:
Formation: In a bearish symmetrical triangle pattern, the price action forms a triangle with a flat bottom (support line) and a descending top (resistance line).
Implications: This pattern typically occurs after a downtrend, signaling a period of consolidation and indecision. A breakout below the lower trendline (support) is considered a bearish signal, indicating a potential continuation of the prior downtrend.
Volume: Similar to the bullish pattern, a breakout in a bearish symmetrical triangle should ideally be accompanied by above-average volume to confirm the strength of the bearish move.
Price Target: Traders often project a price target by measuring the height of the triangle at its widest point and subtracting that distance from the breakout point.
How is a Symmetrical Triangle Pattern Formed?
The symmetrical triangle pattern is a continuation pattern i.e. formed when the price of an asset experiences lower highs and higher lows, creating a series of peaks and troughs that converge towards a point. As the price continues to trade within this narrowing range, the pattern becomes more defined, indicating that a breakout is imminent.
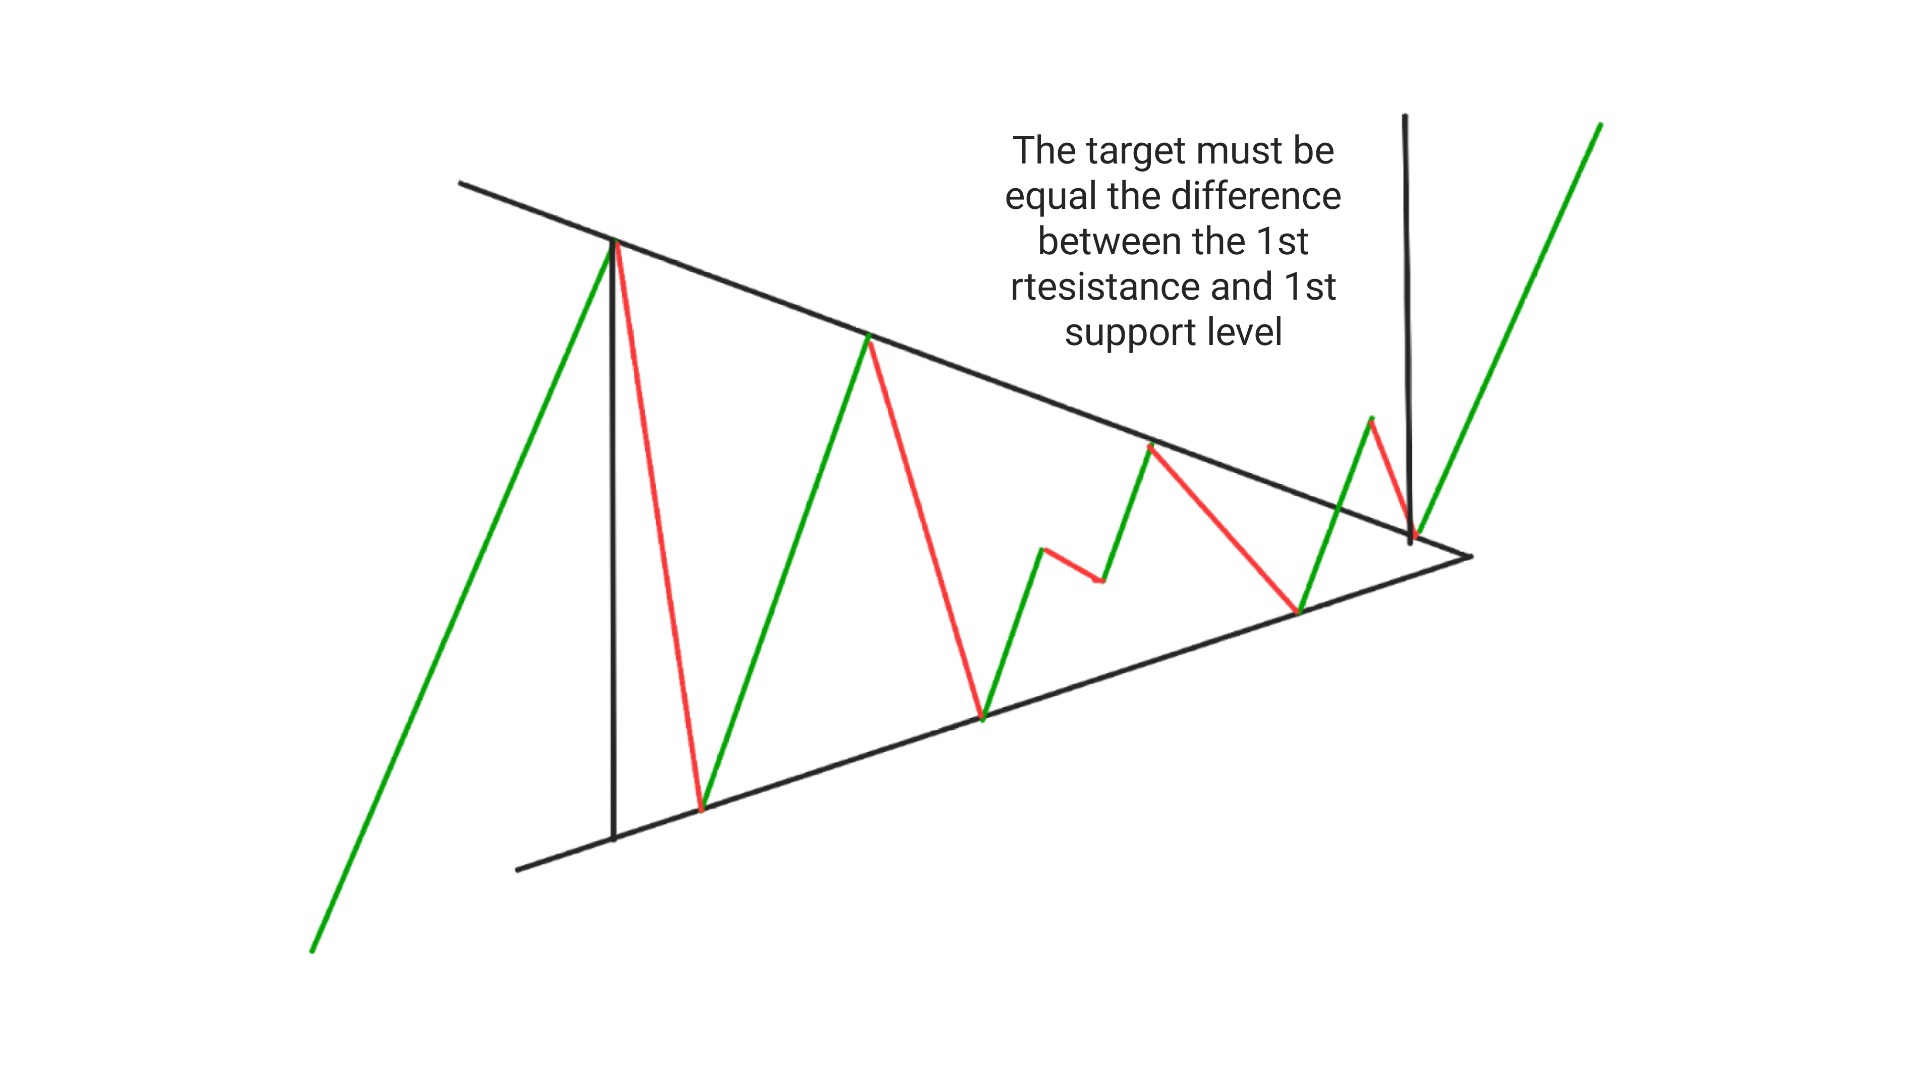
Bullish Symmetrical triangle pattern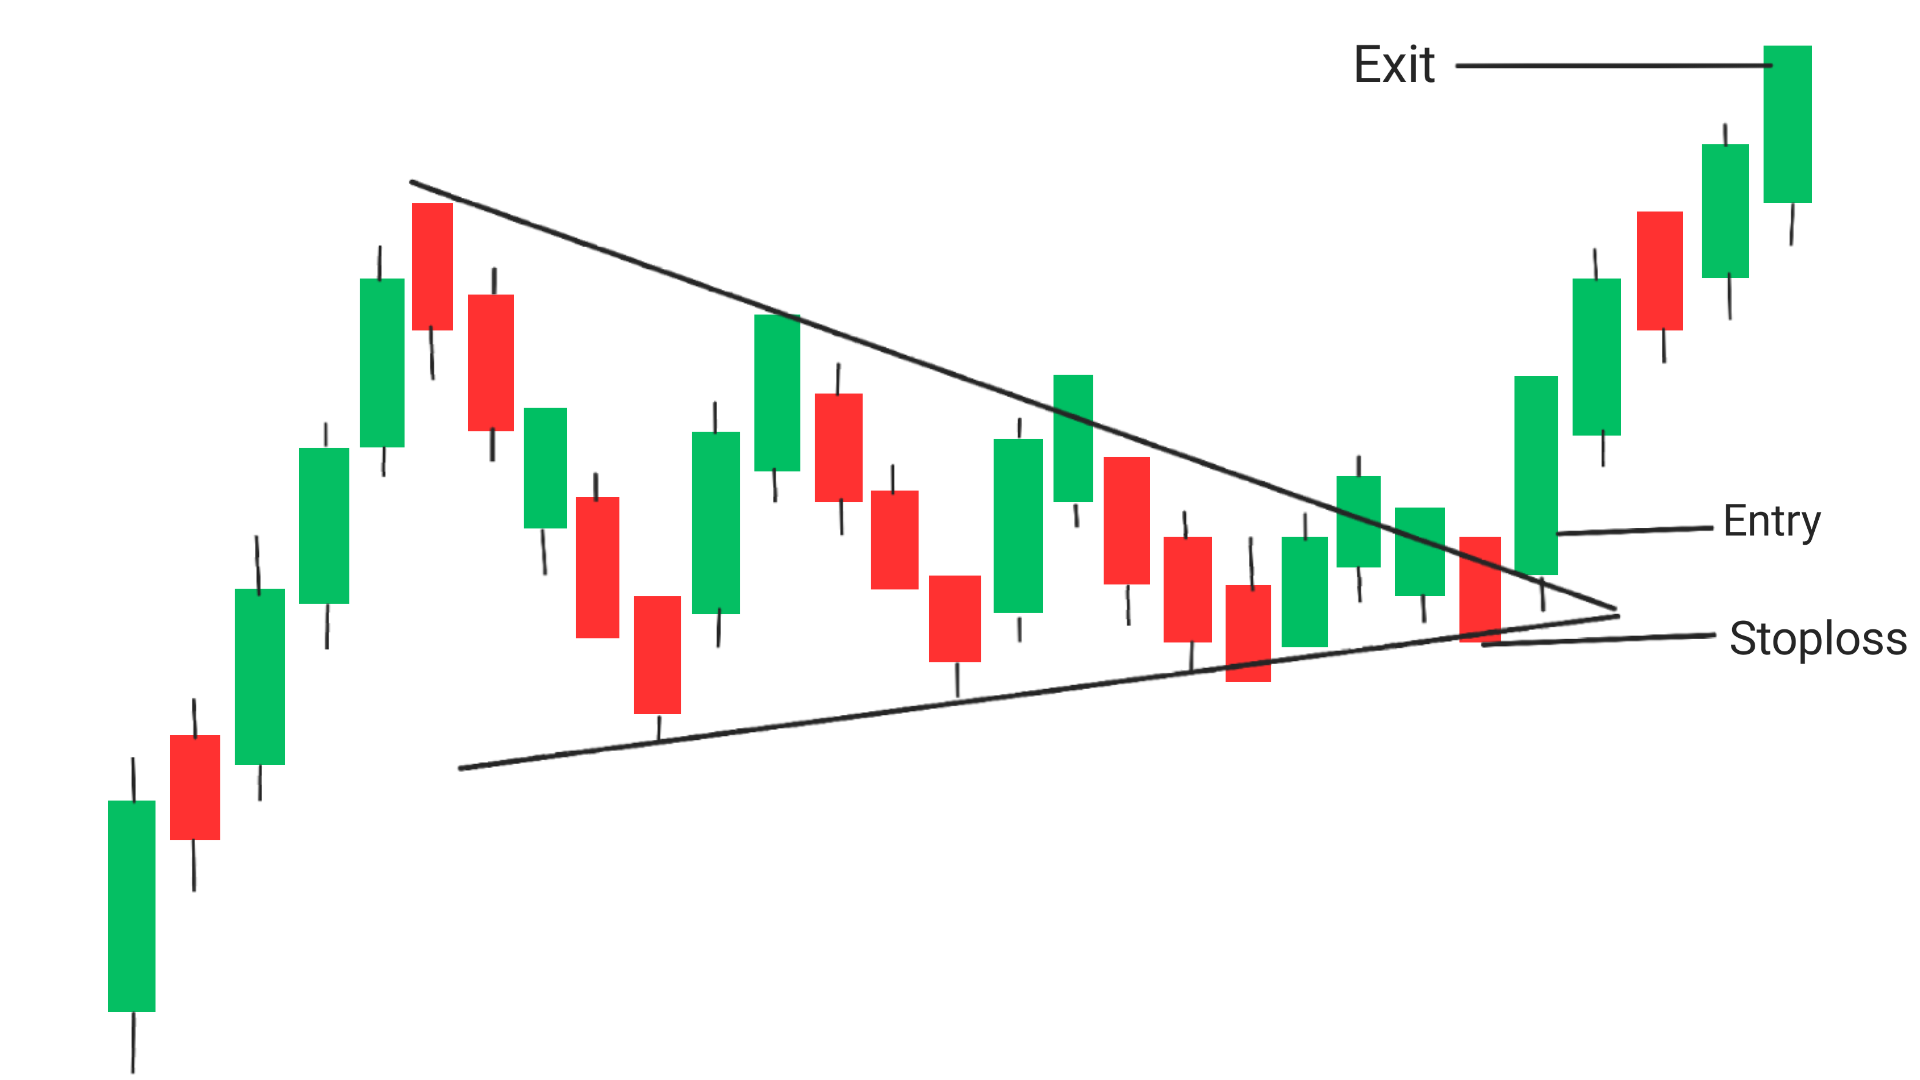
- Initially the price was in uptrend then it takes resistance, After the resistance the price starts falling down and takes 1st support .
- After the 1st support, price starts rising and takes 2nd resistance(This resistance is at lower level than the 1st resistance).
- After the 2nd resistance price again falls down and takes 2nd support and so on this process continues.
- Now draw a trendline touching the resistance and supports, You will observe that these lines converges at point creating a symmetrical triangle.
- Once the price breaks the resistance, The pattern is confirmed (Volume also starts increasing after the breakout)
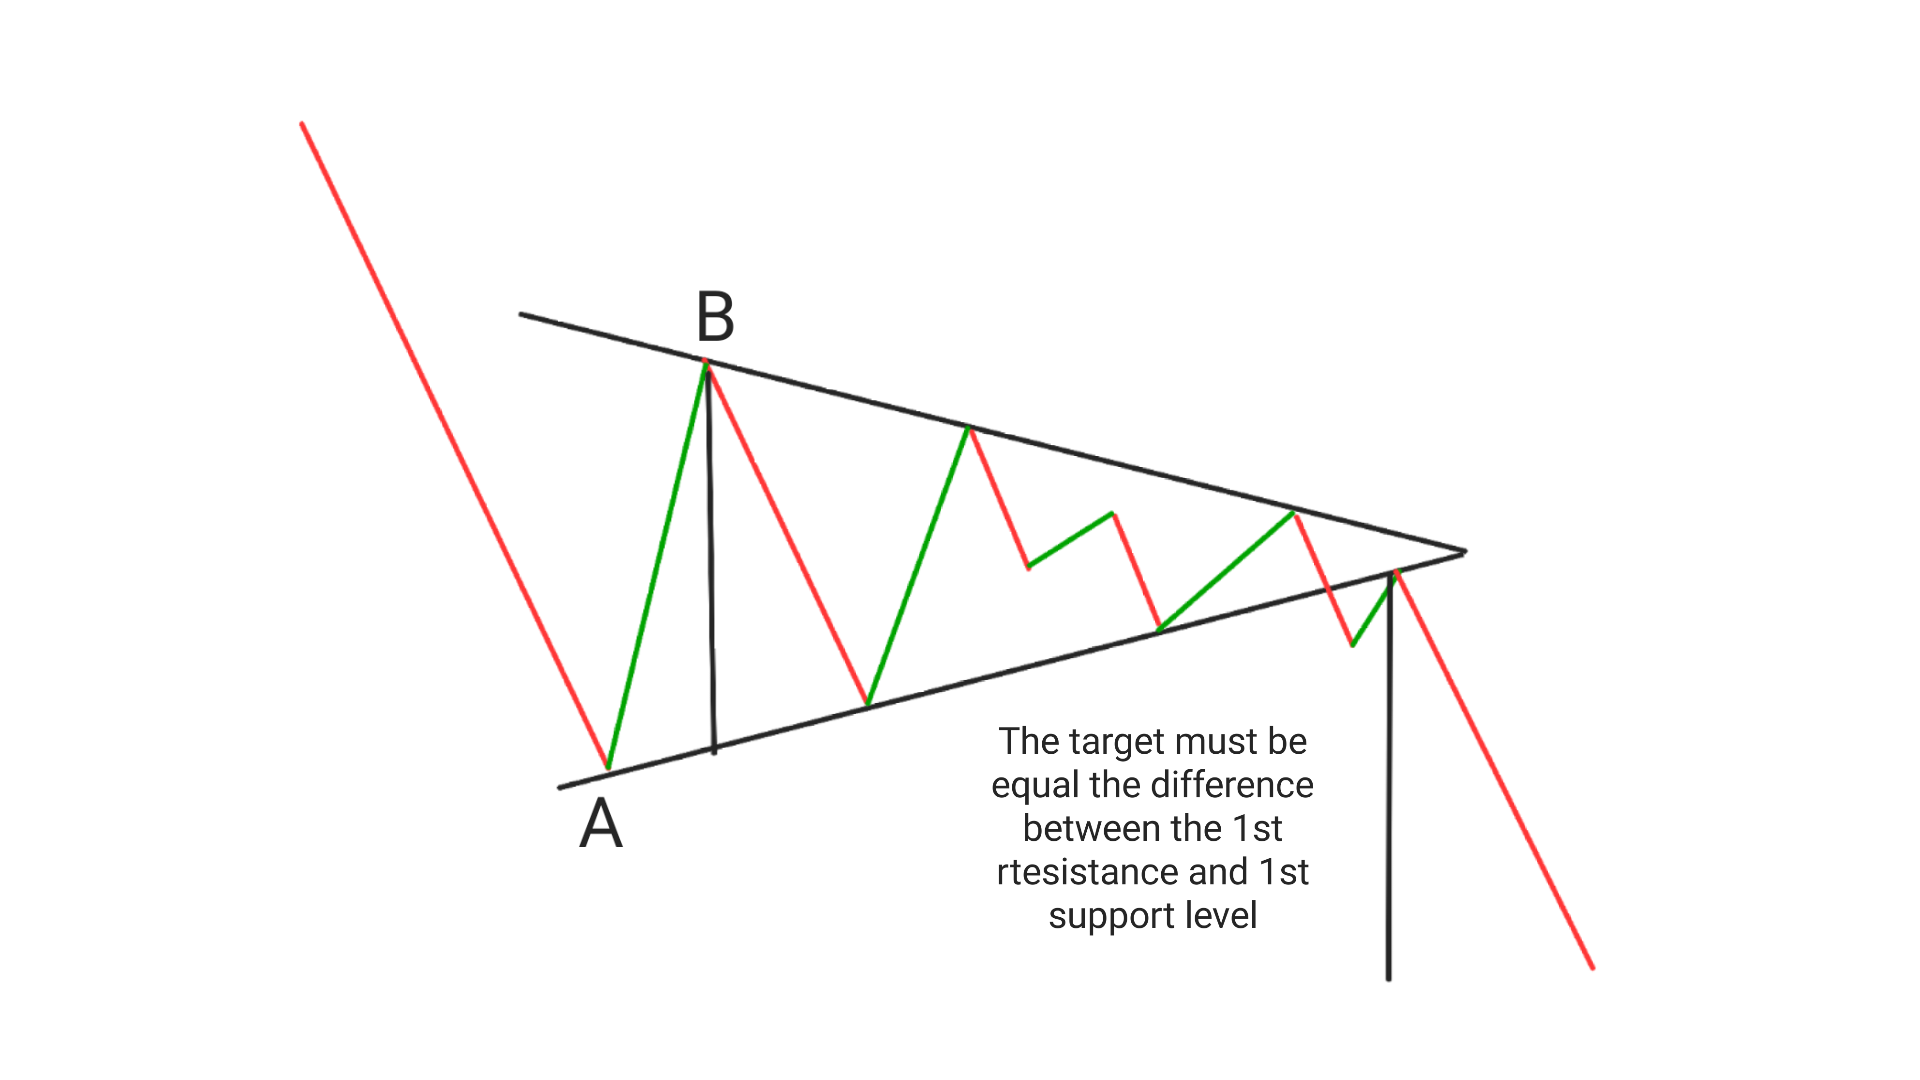
Bearish symmetrical triangle pattern
- Initially the price was in downtrend then it takes support, After the support the price starts rising up and takes 1st resistance .
- After the 1st resistance, price starts falling down and and takes 2nd support (the support is at higher level than the 1st support).
- After the 2nd support price again rises and takes 2nd support and so on this process continues.
- Now draw a trendline touching the resistance and supports, You will observe that these lines converges at point creating a bearish symmetrical triangle.
- Once the price breaks the support, The pattern is confirmed (Volume also starts increasing after the breakout)
How To Identify Symmetrical Triangle Pattern?
To identify a symmetrical triangle pattern, traders should look for the following key characteristics:
1. Converging Trendlines: The symmetrical triangle pattern is characterized by two converging trendlines – one connecting a series of lower highs and the other connecting a series of higher lows. These trendlines form a triangle shape as they converge towards a point.
2. Decreasing Volatility: As the price consolidates within the narrowing range of the symmetrical triangle pattern, volatility tends to decrease. This is reflected in smaller price swings and a tightening trading range.
3. Equal Length of Trendlines: In a symmetrical triangle pattern, the length of the upper trendline (connecting lower highs) and the lower trendline (connecting higher lows) are usually equal. This symmetry gives the pattern its name.
4. Multiple Touch Points: The trendlines of a symmetrical triangle pattern should have multiple touch points, indicating that the pattern is well-defined and has been tested by the market multiple times.
5. Volume Confirmation: Traders should look for confirmation of the symmetrical triangle pattern breakout through increased volume in the direction of the breakout. Higher volume validates the breakout and increases the likelihood of a successful trade.
By keeping an eye out for these key characteristics, traders can effectively identify symmetrical triangle patterns on price charts and use this information to make informed trading decisions.
How to Trade the Symmetrical Triangle Pattern
Trading the symmetrical triangle pattern involves waiting for a breakout to occur before entering a trade. Traders can use the following strategies to capitalize on this pattern:
Bearish symmetric Triangle Pattern:
1. Wait for a Breakout: Traders should wait for the price to break out of the symmetrical triangle pattern before entering a trade. A breakout above the upper trendline signals a bullish continuation, while a breakout below the lower trendline indicates a bearish continuation.
2. Set Stop Loss and Take Profit Levels: Traders should set stop loss and take profit levels to manage risk and maximize profits. Stop loss orders can be placed below the lower trendline for long trades and above the upper trendline for short trades, while take profit levels can be set based on key support and resistance levels.
3. Confirm the Breakout: Traders should confirm the breakout by looking for increased volume and momentum in the direction of the breakout. This helps validate the breakout and reduces the risk of false signals.
Bullish Symmetric Triangle Pattern
Entry: The entry point for the bullish symmetrical triangle is from the next candle which break the resistance level.
Exit: Exit the trade when you have achieved your goal OR when the [price has covered a distance equal to the distance between the 1st resistance and support level.
Stoploss: Stoploss must be set at the low of the candle previous to the candle which give beakout.
Target: Target must be equal to the distance between the 1st resistance and 1st support i.e. difference between the points A and B.
for more example visit here
Conclusion
the symmetrical triangle pattern is a valuable tool for traders looking to identify potential price movements and make informed trading decisions. By understanding how this pattern is formed and implementing effective trading strategies, traders can increase their chances of success in the market.
Symmetrical Triangle pattern target
The target must be equal to the difference between th first reisistance and the first support level
Symmetrical Triangle Pattern Vs Pennant
The symmetrical triangle pattern and the pennant pattern are both technical analysis patterns used in trading to predict potential price movements. Here are some key differences between the two patterns:
1. Symmetrical Triangle Pattern:
Formation: The symmetrical triangle pattern is formed by converging trendlines, with both the upper and lower trendlines sloping towards each other. This creates a triangle shape with no strong bias in terms of slope direction.
Duration: Symmetrical triangles are typically longer-term patterns, indicating a period of consolidation and indecision in the market.
Breakout: Traders often look for a breakout above or below the symmetrical triangle pattern to signal a potential continuation of the previous trend. The breakout direction is not predetermined and could be bullish or bearish.
2. Pennant Pattern:
Formation: The pennant pattern is formed by converging trendlines, similar to the symmetrical triangle, but with a shorter duration and a more vertical flagpole. The trendlines in a pennant pattern are typically parallel, creating a small symmetrical triangle within the larger pattern.
Duration: Pennants are typically shorter-term patterns compared to symmetrical triangles and are often seen as a continuation pattern within a strong trend.
Breakout: Traders often anticipate a breakout in the direction of the previous trend after a pennant pattern, as it suggests a brief pause or consolidation before the trend resumes..
Reverse Symmetrical Triangle Pattern
The term “Reverse Symmetrical Triangle Pattern” is not a commonly recognized technical analysis pattern in trading. However, based on the description, it could refer to a scenario where a symmetrical triangle pattern is forming but with an inverted or reverse slope compared to the typical symmetrical triangle.
In a traditional symmetrical triangle pattern, both the upper and lower trendlines converge towards each other, creating a triangle shape with no strong bias in terms of slope direction. This pattern usually indicates a period of consolidation and indecision in the market, with traders anticipating a breakout in either direction.
If we consider a “Reverse Symmetrical Triangle Pattern,” it could imply that the trendlines are sloping in the opposite direction compared to a standard symmetrical triangle. This could potentially suggest a different market sentiment or trend development. However, without a specific definition or widely accepted interpretation of this pattern, it’s essential to analyze the price action, volume, and other indicators to determine its significance and potential implications for trading decisions.
If you come across a pattern that resembles a reverse symmetrical triangle or have a specific chart you’d like to discuss, providing more details or context could help in understanding the pattern and its implications more accurately.
Ascending Symmetrical Triangle Pattern
The Ascending Symmetrical Triangle Pattern is a common technical analysis pattern that occurs in charts, especially in the context of price action. This pattern is characterized by converging trendlines where the lower trendline is ascending (sloping upwards) and the upper trendline is descending (sloping downwards), creating a triangle shape.
Key features of the Ascending Symmetrical Triangle Pattern include:
1. Trendlines Converge: The trendlines of the pattern converge towards each other, forming a triangle shape. The lower trendline represents higher lows, indicating buying pressure, while the upper trendline represents lower highs, indicating selling pressure.
2. Consolidation Phase: The pattern typically forms after a significant price move and signifies a period of consolidation and indecision in the market as buyers and sellers reach an equilibrium.
3. Anticipated Breakout: Traders often anticipate a breakout from the pattern, which can occur in either direction. A breakout above the upper trendline suggests a bullish continuation, while a breakout below the lower trendline indicates a bearish reversal.
4. Volume Analysis: Volume analysis is crucial when trading the Ascending Symmetrical Triangle Pattern. Increasing volume during the breakout confirms the validity of the move and can provide additional confirmation for traders.
5. Price Target: The price target for the pattern can be determined by measuring the height of the triangle at its widest point and projecting that distance from the breakout point in the direction of the breakout.
Trading the Ascending Symmetrical Triangle Pattern involves waiting for a confirmed breakout and considering factors like volume, momentum, and overall market conditions to make informed trading decisions. As with any technical analysis pattern, it’s essential to combine it with other indicators and risk management strategies for successful trading outcomes.
Frequently Asked Questions(FAQs)
1.How do you make a symmetrical triangle?
To make a symmetrical triangle, draw a horizontal line as the base, then connect the two upper corners to the midpoint of the base with converging trendlines.
2.What is the symmetrical triangle theory strategy?
The symmetrical triangle theory strategy is a technical analysis tool used in trading to predict potential price breakouts. Traders look for the convergence of two trendlines forming a symmetrical triangle pattern, indicating a period of consolidation before a potential breakout.
3.What is a symmetrical triangle pattern in statistics?
In statistics, a symmetrical triangle pattern refers to a triangular distribution of data points that are evenly distributed around the mean, resulting in a symmetrical shape when plotted on a graph.
4.What angle is a symmetrical triangle?
A symmetrical triangle has three angles that are all equal to 60 degrees, making it an equilateral triangle.
5.What is bull flag?
A bull flag is a bullish continuation pattern in technical analysis that occurs after a strong upward price movement (flagpole) followed by a period of consolidation (flag). Traders often interpret this pattern as a signal that the uptrend is likely to continue.