Spinning Top Candlestick
Candlestick charts are an essential tool used by traders to analyze the price movements of assets in the financial markets. A spinning top candlestick is a type of candlestick pattern that can be seen on the charts of various assets, including stocks, forex, and cryptocurrencies. In this blog post, we will explore what a spinning top candlestick is, how it is formed, and what it means for traders.
What is a Spinning Top Candlestick?
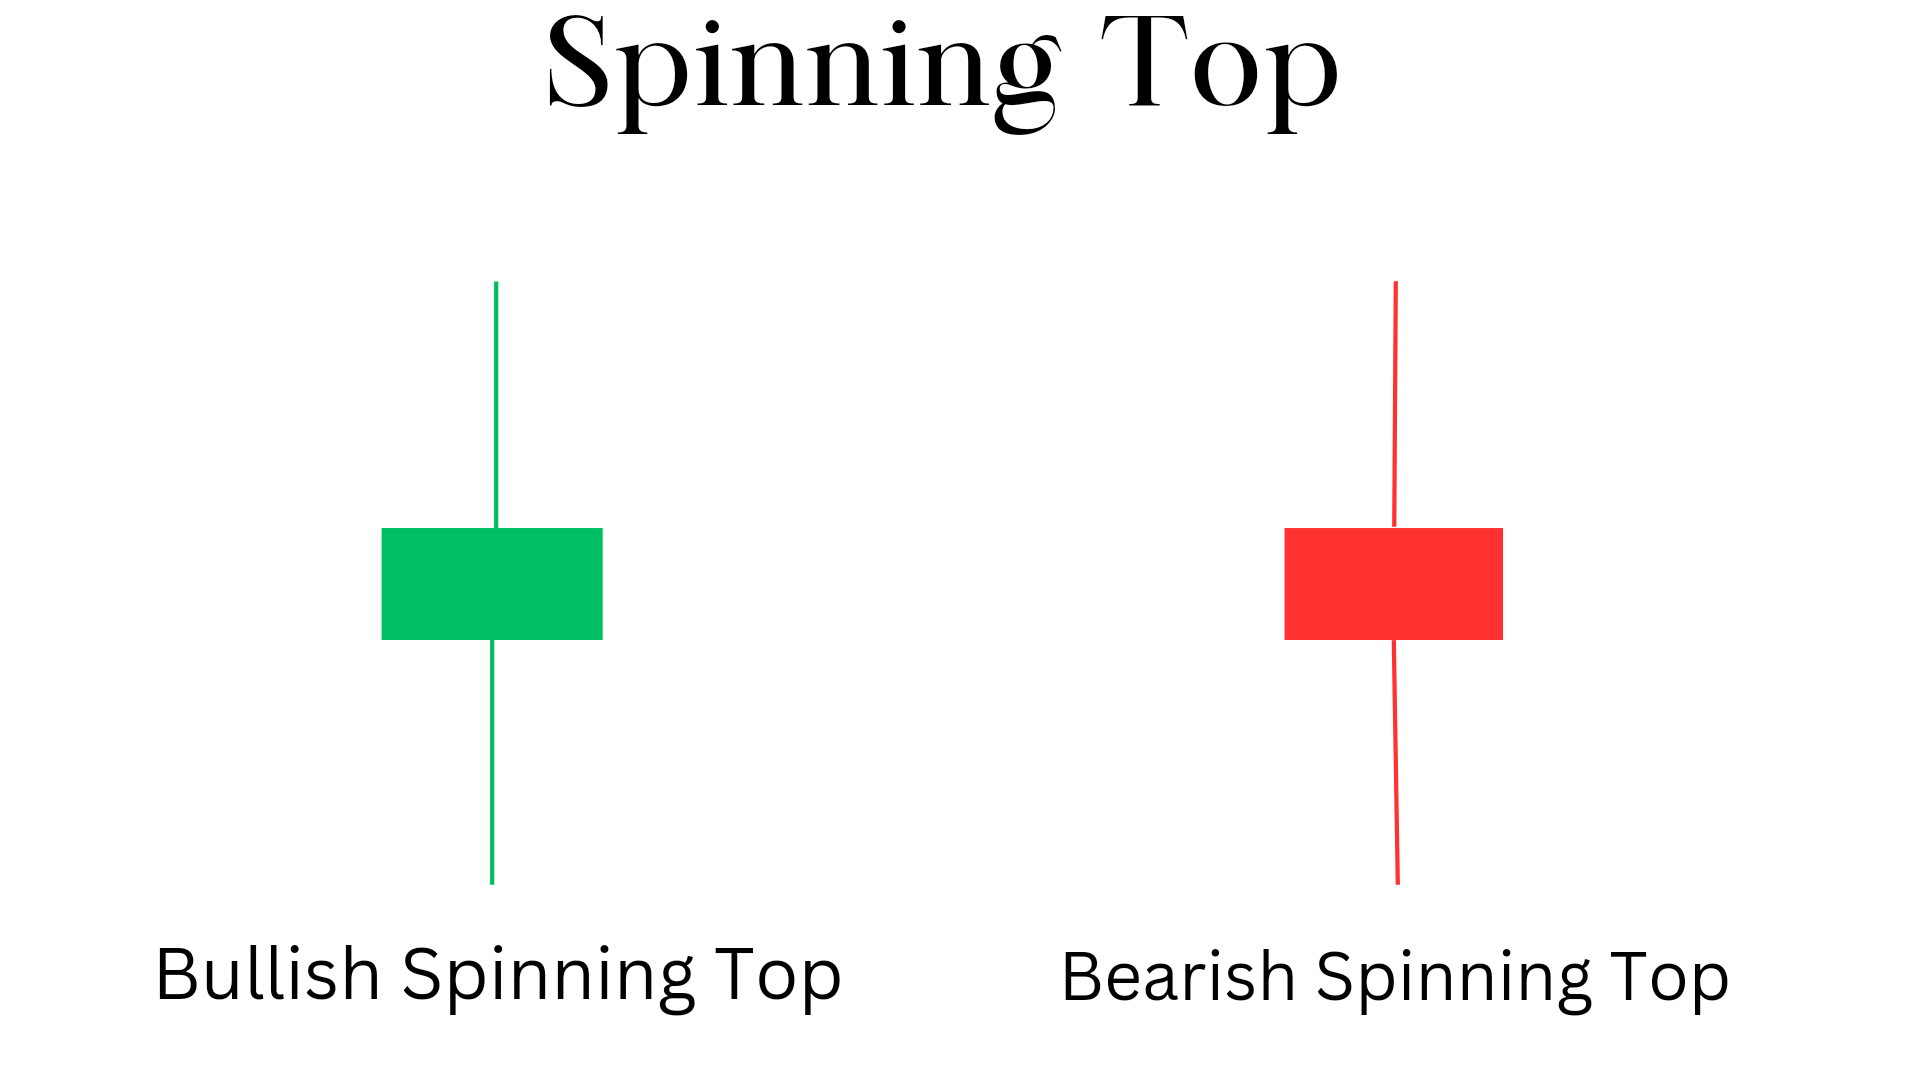
A spinning top candlestick is a type of candlestick pattern that forms when the opening and closing prices are close to each, but there was significant price movent both upward and downward during trading period.This results in a candlestick with a small body and long upper and lower shadows or wicks.This pattern signals a sentiment of indecision in the market.
The length of the shadows or wicks indicates the level of volatility during the trading period. If the shadows are long, it indicates that there was a significant price movement during the trading period, while short shadows indicate low volatility.
key features of spinning top candlestick
• A small real body is a characteristic of a candlestick chart pattern that indicates a relatively small difference between the opening and closing prices of an asset. This suggests that there is indecision in the market regarding the direction of the trend.
• Long upper and lower shadows are also known as wicks, and they indicate that the price of the asset has moved significantly above and below the opening and closing prices during the trading period. This suggests that there is volatility in the market and that traders are unsure about the direction of the trend.
• The neutral color of the candlestick chart pattern means that there is no clear indication of whether the buyers or sellers are in control of the market. This further emphasizes the indecision in the market.
• The indecision in the market suggests that traders are waiting for more information before making a decision about whether to buy or sell an asset. This makes it important to wait for confirmation of a trend reversal or continuation before making any trades.
• Confirmation can be obtained through technical analysis tools such as moving averages, oscillators, and trendlines. These tools can help traders identify key levels of support and resistance, as well as potential entry and exit points for trades.
• In summary, a candlestick chart pattern with a small real body, long upper and lower shadows, and a neutral color indicates indecision in the market. Traders should wait for confirmation of a trend reversal or continuation before making any trades, using technical analysis tools to identify key levels and potential entry and exit points.
How is a Spinning Top Candlestick Formed?
A spinning top candlestick is formed when the opening and closing prices of an asset are close to each other, but the asset experiences significant price movements during the trading period. This results in a candlestick with a small body and long upper and lower shadows or wicks.
For example, let’s say that the opening price of an asset is $100, and the closing price is $102. However, during the trading period, the asset’s price moved between $95 and $105. This would result in a spinning top candlestick with a small body and long upper and lower shadows or wicks.
Best seller Mastermind Book to learn trading from scratch along with proper examples is here
The spinning top candlestick pattern is a neutral pattern that indicates indecision between buyers and sellers. It has a small body and long upper and lower shadows. When trading using this pattern, it’s important to consider the following:
Spinning Top trading strategy
Entry point: The entry point for a spinning top candlestick pattern will depend on the trader’s strategy. Some traders may wait for confirmation of a trend reversal or continuation before entering a trade. Others may use support and resistance levels to determine their entry point.
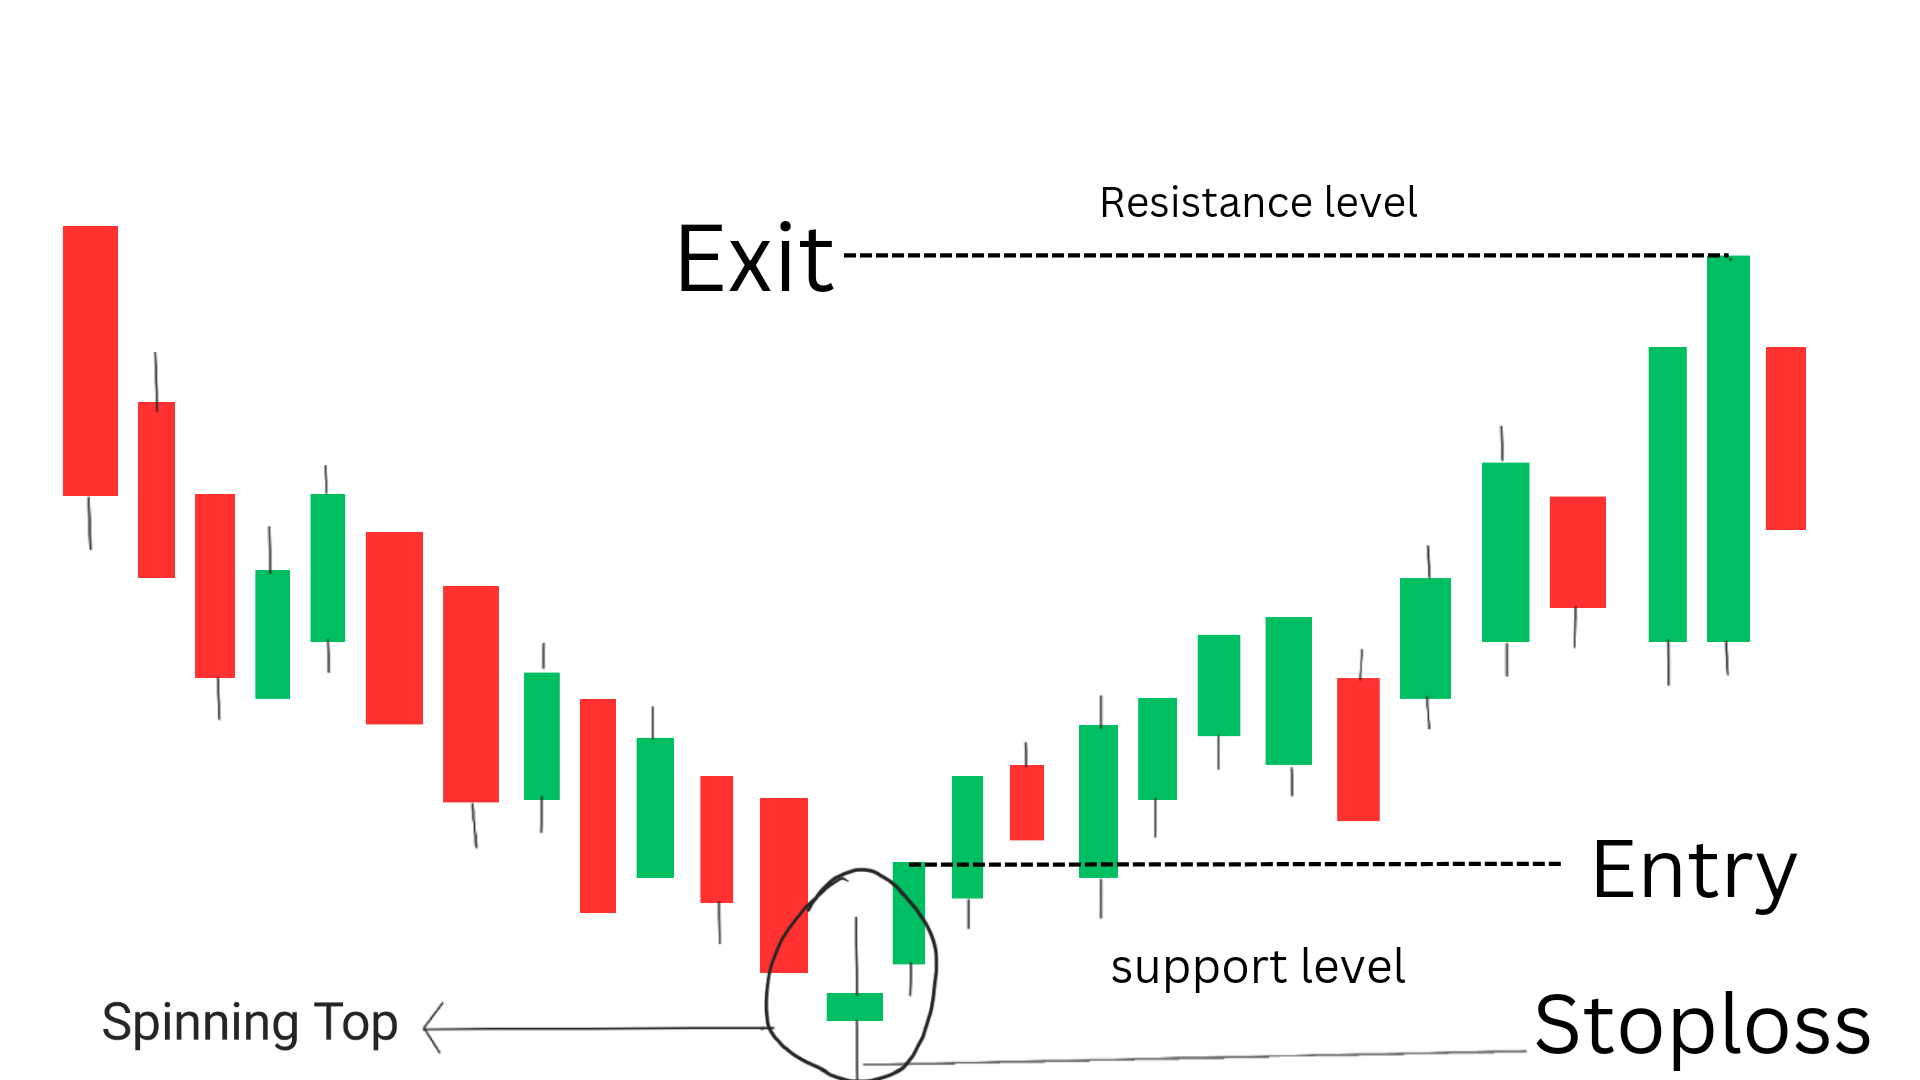
Exit point: Traders can exit their trade when the price reaches their profit target or when the market shows signs of reversing. Some traders may also use trailing stop orders to lock in profits.
Stop loss point: To manage risk, traders should set a stop loss order below the low of the spinning top candlestick pattern. This will limit their potential losses if the market moves against them.
Overall, trading using spinning top candlestick patterns requires careful analysis and risk management. Traders should develop a solid strategy and stick to their plan to increase their chances of success.
What Does a Spinning Top Candlestick Mean for Traders?
A spinning top candlestick indicates indecision in the market. It shows that neither buyers nor sellers were able to gain control of the asset during the trading period. Traders interpret this as a sign of potential price reversal or continuation of the current trend.
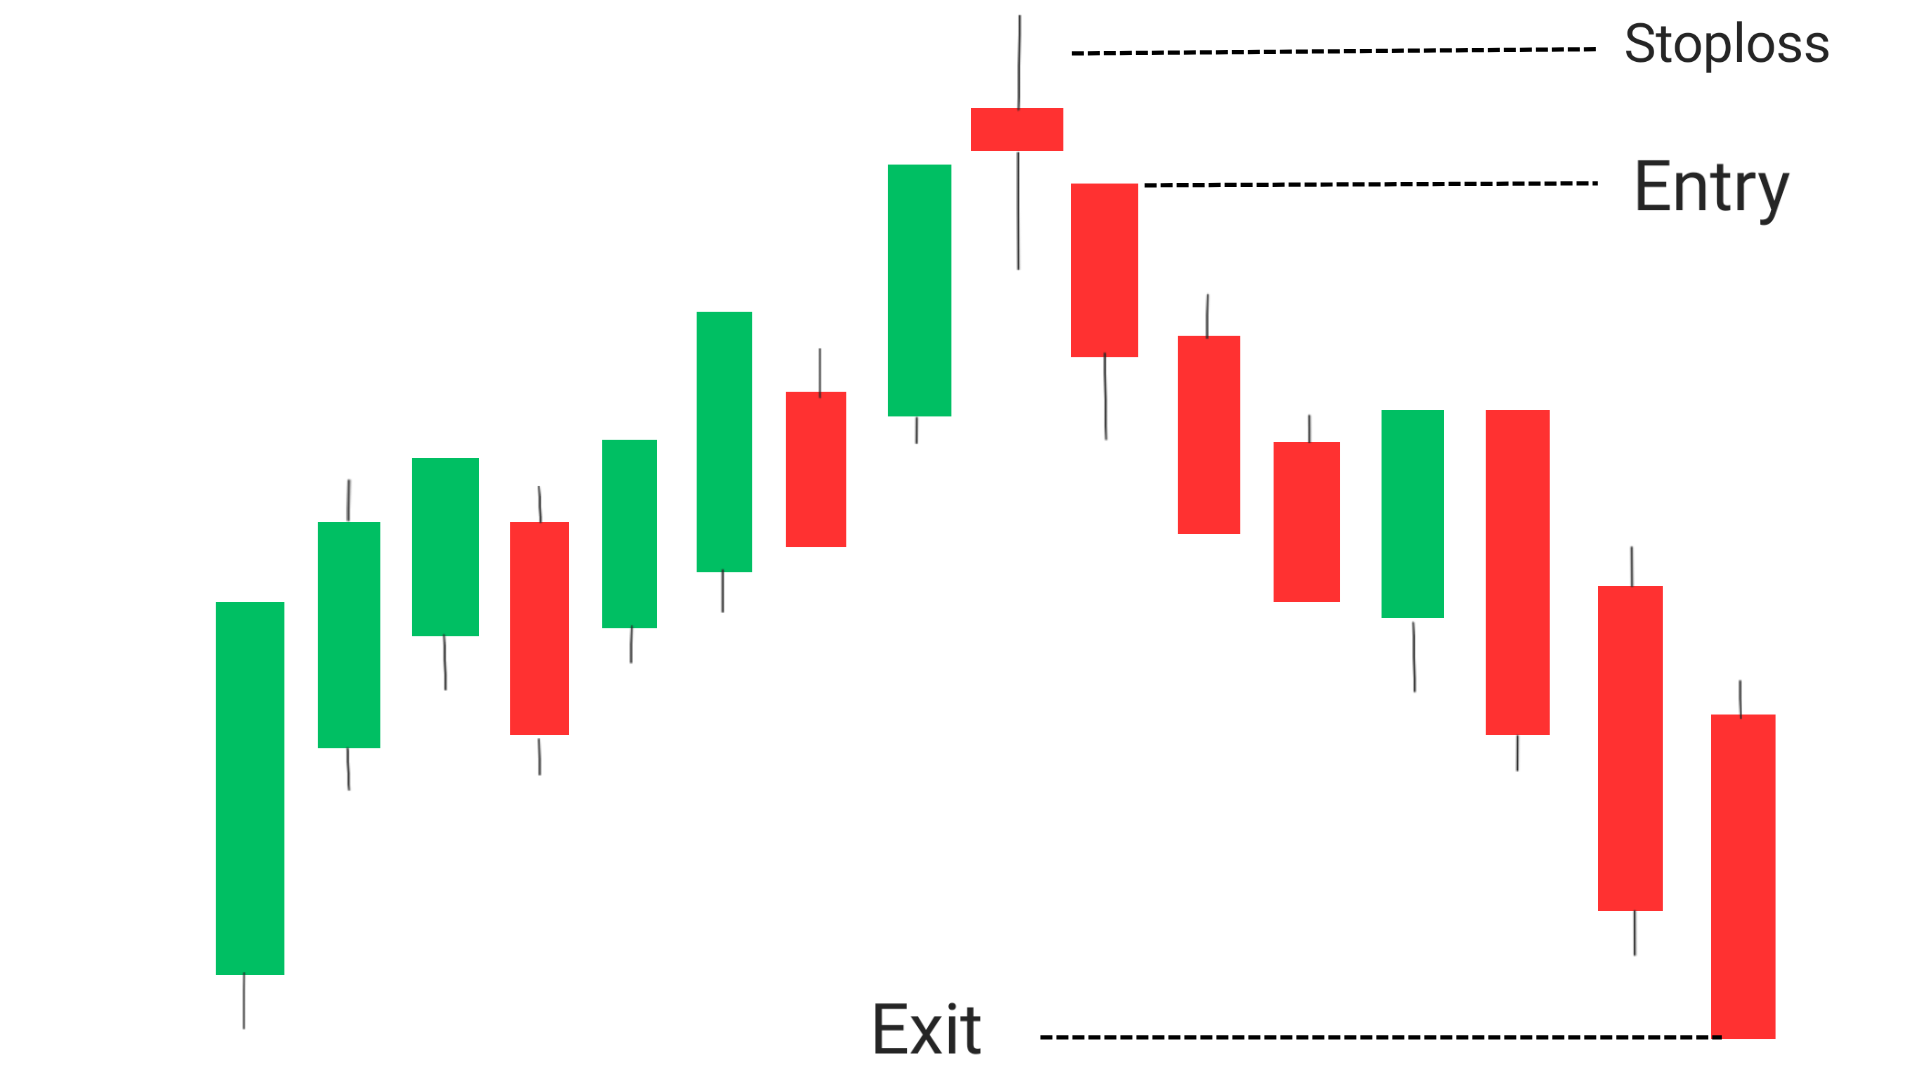
If a spinning top candlestick appears during an uptrend, it could indicate that the buyers are losing momentum, and the trend may be coming to an end. Conversely, if a spinning top candlestick appears during a downtrend, it could Indicate that the sellers are losing momentum, and the trend may be coming to an end.
Traders use spinning top candlesticks in conjunction with other technical indicators and chart patterns to make informed trading decisions. For example, if a spinning top candlestick appears after a long uptrend and is followed by a bearish candlestick, it could be a sign of a trend reversal, and traders may consider selling their positions.
Success rate of spinning top candlestick pattern
according to some reports, the success rate of spinning top candlestick pattern is about 56% ,which means for every 2 trade taken you will be able to make profit in 1 out of 2.
let us take an example, how this 56% can help you in making profits
SITUATION 1: you failed in your trade
- Taken trade at $100 and your stoploss is $99, you puchased 100 shares.
- your stoploss got hit and you lose $100.
- loss $100
SITUATION 2: you were able to make profit
- you took trade at $100, and stoploss is $99, you purchased 100 shares.
- you exit the trade when it reaches $105.
- you made $500, total profit $500-$100=$400.
- even with 56% percent success rate you were able to make $400 in just 2 trades.
Conclusion
A spinning top candlestick is a type of candlestick pattern that indicates indecision in the market. It is formed when the opening and closing prices of an asset are close to each other, but the asset experiences significant price movements during the trading period. Traders use spinning top candlesticks in conjunction with other technical indicators and chart patterns to make informed trading decisions. Understanding spinning top candlesticks can help traders identify potential trend reversals and continuation of the current trend.
Frequently Asked Questions (FAQs)
1.What is the difference between a pin bar and a spinning top?
A pin bar has a small body and a long wick or tail, with the wick/tail being at least two times longer than the body. It indicates a potential reversal in the trend. A spinning top has a small body and long upper and lower shadows/wicks, indicating indecision in the market.
2.What does the top of the candlestick mean?
The top of the candlestick represents the highest price reached during the trading period.
3.What is the difference between a spinning top and a high wave candle?
A spinning top has a small body and long upper and lower shadows or wicks, indicating indecision in the market. A high wave candle has a long upper shadow and a long lower shadow, indicating volatility in the market with significant price movements in both directions.
1 thought on “Spinning Top Candlestick:definition, 3 FAQs”