Shooting Star Doji
In the world of tecnical analysis, candlestick patterns are a popular tool used by traders to identify potential trend reversals in the market. One such pattern is the shooting star doji, which is a bearish reversal pattern that can provide valuable insights into the market’s direction. In this blog, we will discuss what the shooting star doji is, how it works, and how traders can use it to make informed trading decisions.

What is a Shooting Star Doji?
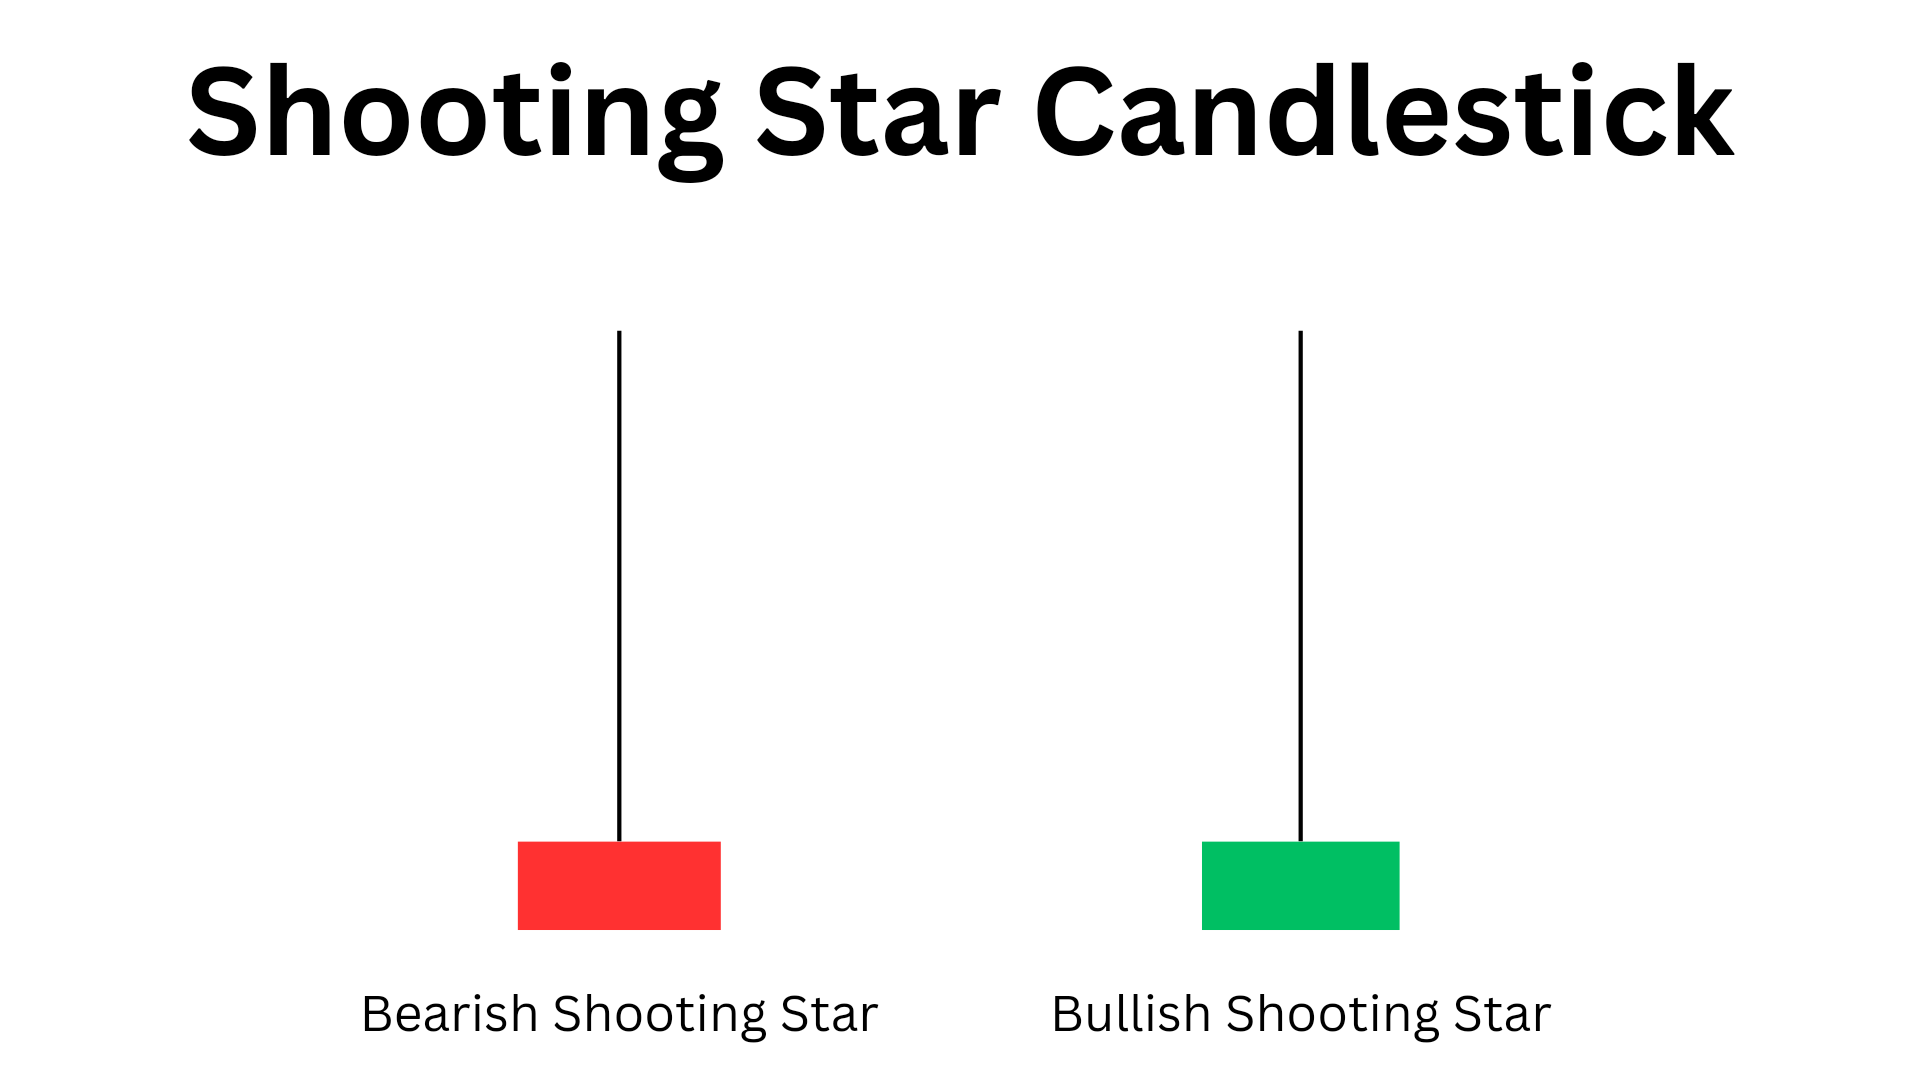
A shooting star doji is a single candlestick bearish reversal pattern that occurs when the open, high, and close prices are almost the same, creating a small real body, while the lower shadow is much longer than the real body. The pattern resembles a shooting star with a long tail, hence its name.
It is a bearish reversal pattern that indicates that the market has tried to push higher but has failed, and the bears have taken control of the market. The long lower shadow represents the bears’ strength, and the small real body shows that the bulls have lost their momentum.
How Does a Shooting Star Doji Work?
This candle works by providing traders with a signal to sell or short the market. The pattern suggests that the bulls have lost their momentum and that the bears have taken control of the market. Traders can use this information to make informed trading decisions.
For example, if this candle forms after a prolonged uptrend, it could indicate that the market is about to reverse. Traders can use this signal to sell or short the market, anticipating a potential downtrend.
On the other hand, if a shooting star doji forms after a prolonged downtrend, it could indicate that the market is about to reverse. Traders can use this signal to buy or go long on the market, anticipating a potential uptrend.
Top Bestseller mastermind book to learn trading from scratch along with examples click here.
How to Identify a Shooting Star Doji?
To identify a shooting star doji, traders need to look for the following characteristics:
1. The candlestick has a small real body.
2. The candlestick has a long lower shadow.
3. The open, high, and close prices are almost the same.
4. The pattern occurs after a prolonged uptrend.
5. The pattern occurs after a prolonged downtrend.
Traders should also look for confirmation from other technical indicators, such as trend lines, moving averages, and oscillators, before making any trading decisions.
How to Trade a Shooting Star Doji?
Traders can trade a shooting star doji by following these steps:
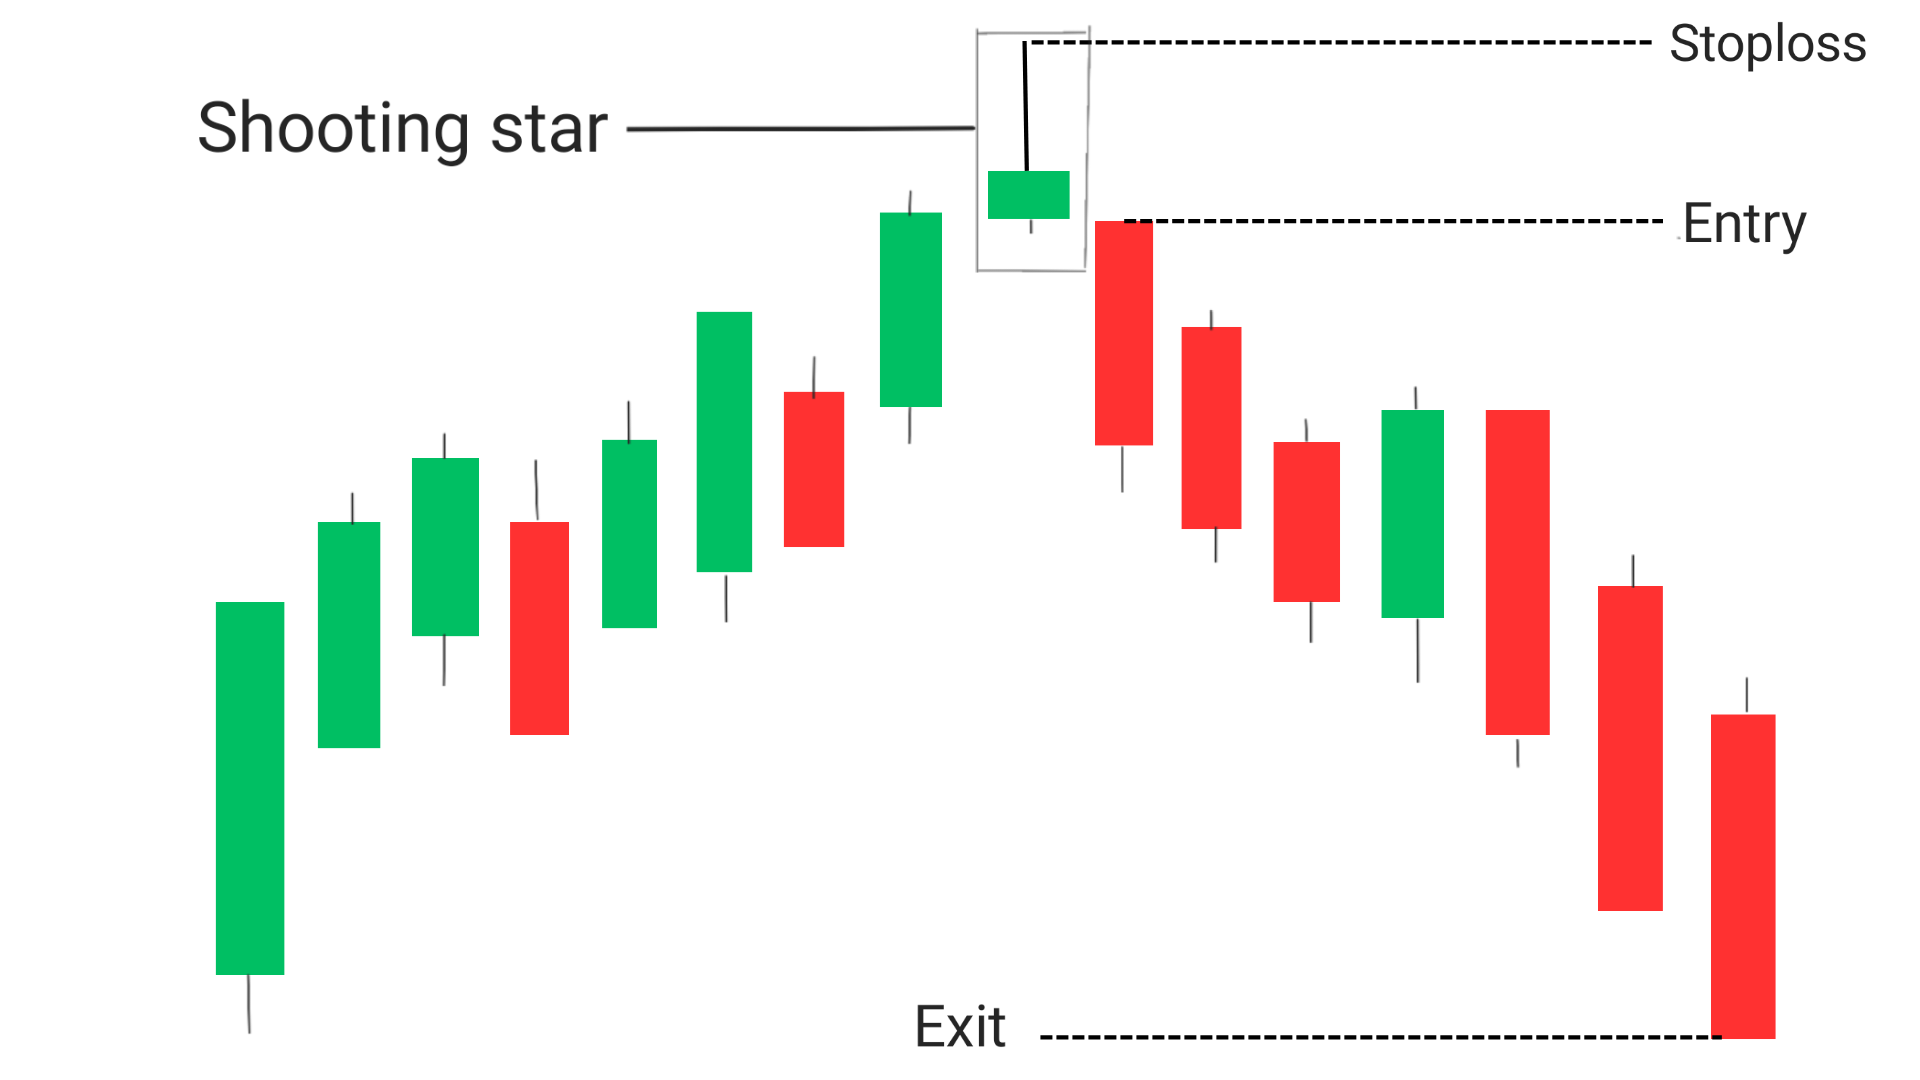
Entry:The entry for a shooting star doji pattern is typically below the low of the candlestick.
Exit: The exit can be set at a predetermined profit target or by using a trailing stop-loss. The best to exit the trade is when it reaches a support level. If you want to trade more look for a breakout at the support level, if it happens then trade to the next support level.
Stoploss:The stop-loss should be placed above the high of the shooting star candlestick to limit potential losses in case the pattern fails. The exact entry, exit, and stop-loss levels may vary depending on the trader’s individual trading strategy and risk tolerance.
this are the steps to be followed before taking a trade using this candslestick pattern.
1. Identify the shooting star doji pattern on the chart.
2. Look for confirmation from other technical indicators, such as trend lines, moving averages, and oscillators.
3. Place a sell or short order if the shooting star doji forms after a prolonged uptrend.
4. Place a buy or long order if the shooting star doji forms after a prolonged downtrend.
5. Set a stop loss to limit potential losses.
6. Take profits at predetermined levels or use trailing stops to maximize profits.
Success Rate : the success rate of shooting star doji s about 70% , which means if you have taken 10 trade there are huge chances that you will make rofit in 7 out of those 10 trades.
Conclusion
The shooting star doji is a bearish reversal pattern that can provide valuable insights into the market’s direction. Traders can use this pattern to make informed trading decisions and anticipate potential trend reversals. However, traders should always use caution and look for confirmation from other technical indicators before making any trading decisions. By following these steps, traders can use the shooting star doji to their advantage and make profitable trades in the market.
Frequently Asked Questions(FAQs)
1.Is Evening Star a bearish or bullish?
Evening Star is a bearish candlestick pattern.
2.Is a doji bullish or bearish?
A doji can be either bullish or bearish, depending on whether it is formed at downtrend or uptrend in which it appears.
3.What does a bullish doji star mean?
A bullish doji star is a candlestick pattern that appears after a downtrend and signals a potential reversal. It has a small real body and long lower shadow, indicating that prices fell significantly during the session before buyers stepped in to push prices back up.
4.What is evening star candle?
An evening star candle is a bearish reversal pattern that consists of three candles: a large bullish candle, followed by a small indecisive candle (such as a doji), and then a large bearish candle. It indicates that buyers have lost control and that sellers are taking over.
5.Is doji Star bearish?
A doji star can be either bullish or bearish, depending on the context in which it appears
6. What is the difference between a shooting star and a hammer candlestick pattern?
A shooting star and a hammer are both candlestick patterns, but they have different implications. A hammer is a bullish reversal pattern that occurs at the bottom of a downtrend, while a shooting star is a bearish reversal pattern that occurs at the top of an uptrend.
7. Can a shooting star doji occur in any market?
Yes, a shooting star doji can occur in any market, including stocks, forex, and commodities.
8. How reliable is the shooting star doji pattern?
The reliability of the shooting star doji pattern depends on several factors, such as the market conditions and the confirmation from other technical indicators. Traders should always use caution and look for confirmation before making any trading decisions.
9. What is the difference between a shooting star and an inverted hammer candlestick pattern?
An inverted hammer is a bullish reversal pattern that occurs at the bottom of a downtrend, while a shooting star is a bearish reversal pattern that occurs at the top of an uptrend. The difference between the two patterns is the implication for the market’s direction.
10. Can traders use the shooting star doji in isolation to make trading decisions?
Traders should not rely solely on the shooting star doji to make trading decisions. They should always look for confirmation from other technical indicators before making any trades.