How To Trade Red inverted hammer? all details, 4 FAQs
The red inverted hammer candlestick pattern is a powerful tool in the world of technical analysis that can help traders in identifying potential trend reversals in the market. After reading this blog you will be able yo easily identify inverted hammer and shooting star.
learn all candlestick pattern in one place, do check bestselling trading books on here.
What is the Red Inverted Hammer Candlestick Pattern?
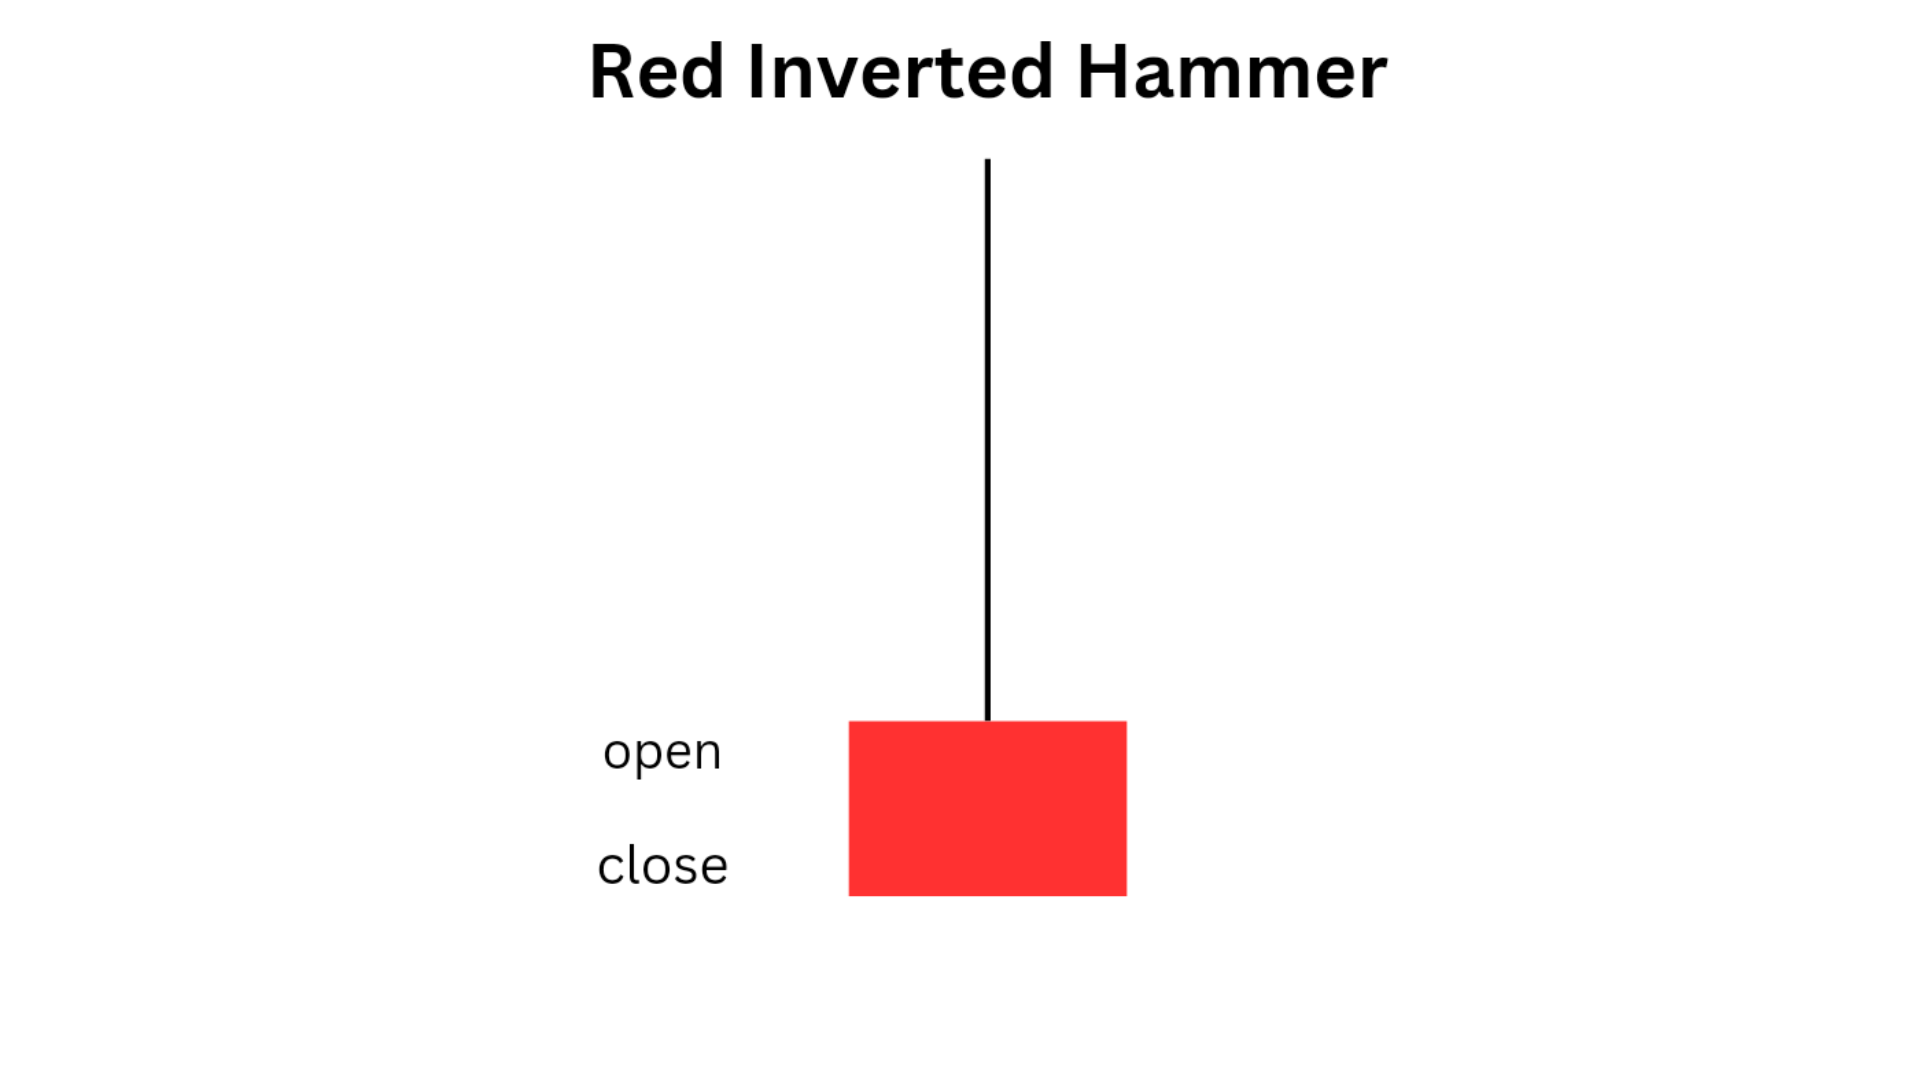
The red inverted hammer is a single candlestick bullish reversal pattern that is formed at the end of an downtrend. It consists of a long upper wick and a small body at the bottom of the candle, resembling a inverted hammer. This pattern suggests that selling pressure may be weakening and a potential bullish reversal may occur.
What does a Red inverted hammer indicates?
When the red inverted hammer pattern appears after a downtrend, it signals that buyers are stepping in and that the trend may be about to reverse. However, it is important to confirm this pattern with other technical indicators such as support and resistance levels, moving averages, and trend lines to validate its significance. This helps to reduce the risk of false signals and provides a more comprehensive view of the market dynamics.
How to Identify a Red Inverted Hammer?
People have a lot of confusion between inverted hammer and shooting star . So, here are some ways through which one can easily differentiate between them and a detailed difference between these is provided below.
To identify a red inverted hammer, look for a small body at the bottom of the candlestick, with a long upper shadow . The open, high, and close prices should be very close to each other. This pattern indicates that although there was initially buying pressure, the bears were able to push the price back down by the end of the session.
Inverted hammer vs shooting star
| Shooting Star | Inverted Hammer |
|---|---|
| A shooting star is a bearish candlestick pattern which forms at the top of an uptrend. It indicates a bearish reversal. which can covert uptrend into downtrend. | An inverted hammer is a bullish candlestick pattern which appears at the bottom of downtrend.It can covert bearish movement to bullish. |
| It forms at top of an uptrend. | it forms at the bottom of a downtrend. |
| visual appearance resmebles of a star with long tail. its long upper shadow, represents the seller pushing price lower. | It's visual appearance looks like upside down hammer. Its long lower shadow , indicates that buyers are pushing the price higher. |
| Shooting star suggests that sellers are dominating buyers, signalling a potential trend reversal. | Inverted hamer suggests that buyers are dominating over seller. |
| shooting star indicates that buyers are losing control and a bearish move may come. | inverted hammer suggests that sellers are losing control and a bullish move move is about to follow. |
| the long upper shadow acts as a resistance level for the price to move higher. | the lower shadow act as a support level for the price, as it indicates price may suffer to move lower. |
| The shooting star indicates a bearish reversal | The inverted hammer indicates a bullish reversal. |
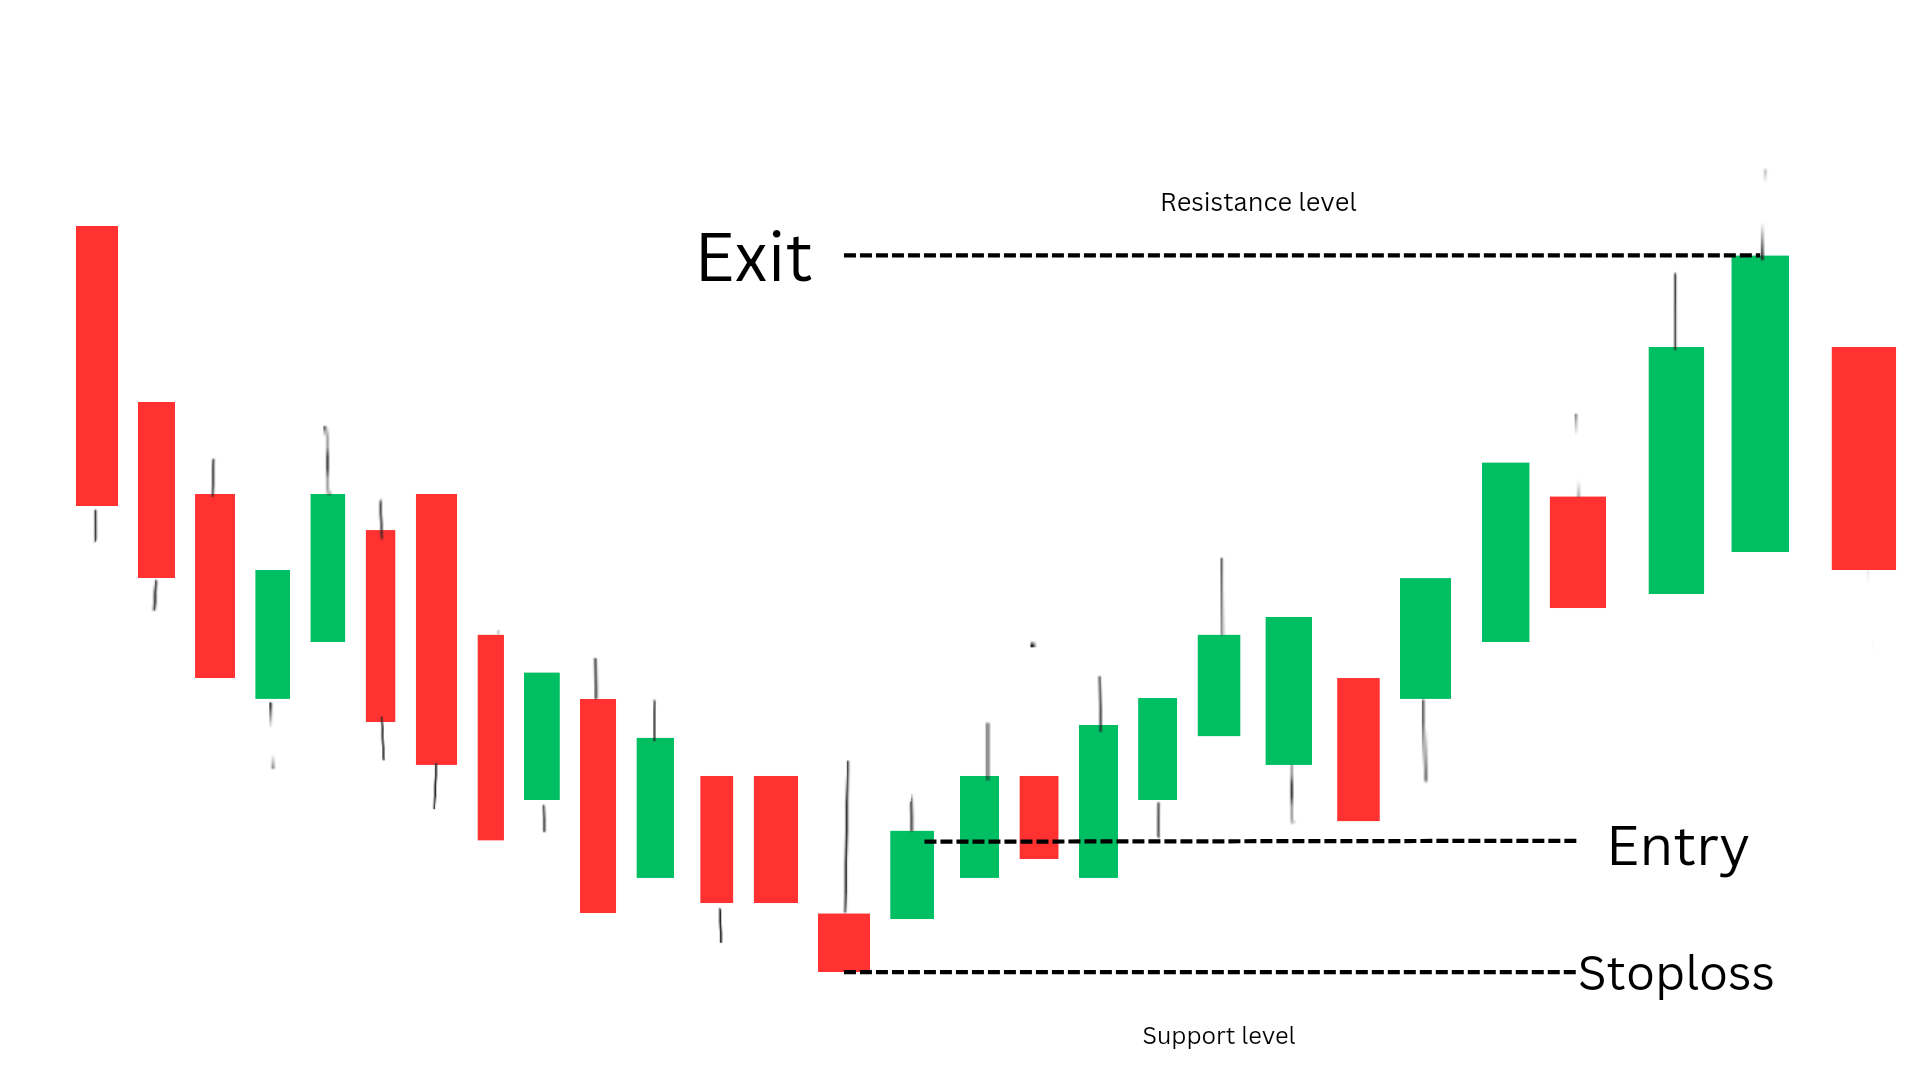
How to trade using Red Inverted Hammer?

ENTRY : In order to minimise the risk, traders can enter the trade from the candle next to red inverted hammer, especially when it is formed at support level of price movements.
• EXIT : The best time to exit a trade is when it reaches resistance level, if you want to trade more then you can look for real breakouts if that happpens then take trade to the next resistance level.
• STOPLOSS: You must set the stoploss at the bottom of the inverted hammer, this will minimize the rusk of hitting stoploss and losing some portion of money.
Traders can use this pattern to make informed trading decisions. If a red inverted hammer forms at the end of a downtrend, it may signal a potential reversal in the trend. Traders could look for confirmation from other technical indicators, such as moving averages or volume analysis, before entering a long position.
The red inverted hammer candlestick pattern is a valuable tool for identifying potential trend reversals in the market. When it is used in combination with other technical analysis tools and risk management strategies, it can provide valuable insights into market dynamics and help traders take trading decisions more precisely. By understanding how to use this pattern effectively, traders can improve their chances of success in the market.
Frequently Asked Questions
1.What does a red inverted hammer mean?
A red inverted hammer is a bullishish reversal candlestick pattern. It indicates that the price of an asset may start to rise after an uptrend.
2.How is inverted hammer bullish?
An inverted hammer is bullish candlestick pattern when it appears at the end of a downtrend. It suggests that the buyers are getting weak and buyers may start to push the price higher.
3.Is the inverted hammer good or bad?
The inverted hammer can is good, as it can can convert downtrend into uptrend which help traders to take take decisions with more accuracy.
4. what is red inverted hammer candlestick?
A red inverted hammer candlestick is a single candlestick bullish reversal patter, it may convert downtrend into uptrend when formed at the bottom of a downtrend.