On Neck Candlestick Pattern
Candlestick patterns are one of the most popular tool for technical analysts used to identify potential trend reversals and price movements. One such candlestick pattern is the On Neck Candlestick Pattern, which is a bearish reversal pattern that signals a potential trend reversal from an uptrend to a downtrend. In this post we will discuss all the details of on neck candlestick pattern.

What is the On Neck Candlestick Pattern?
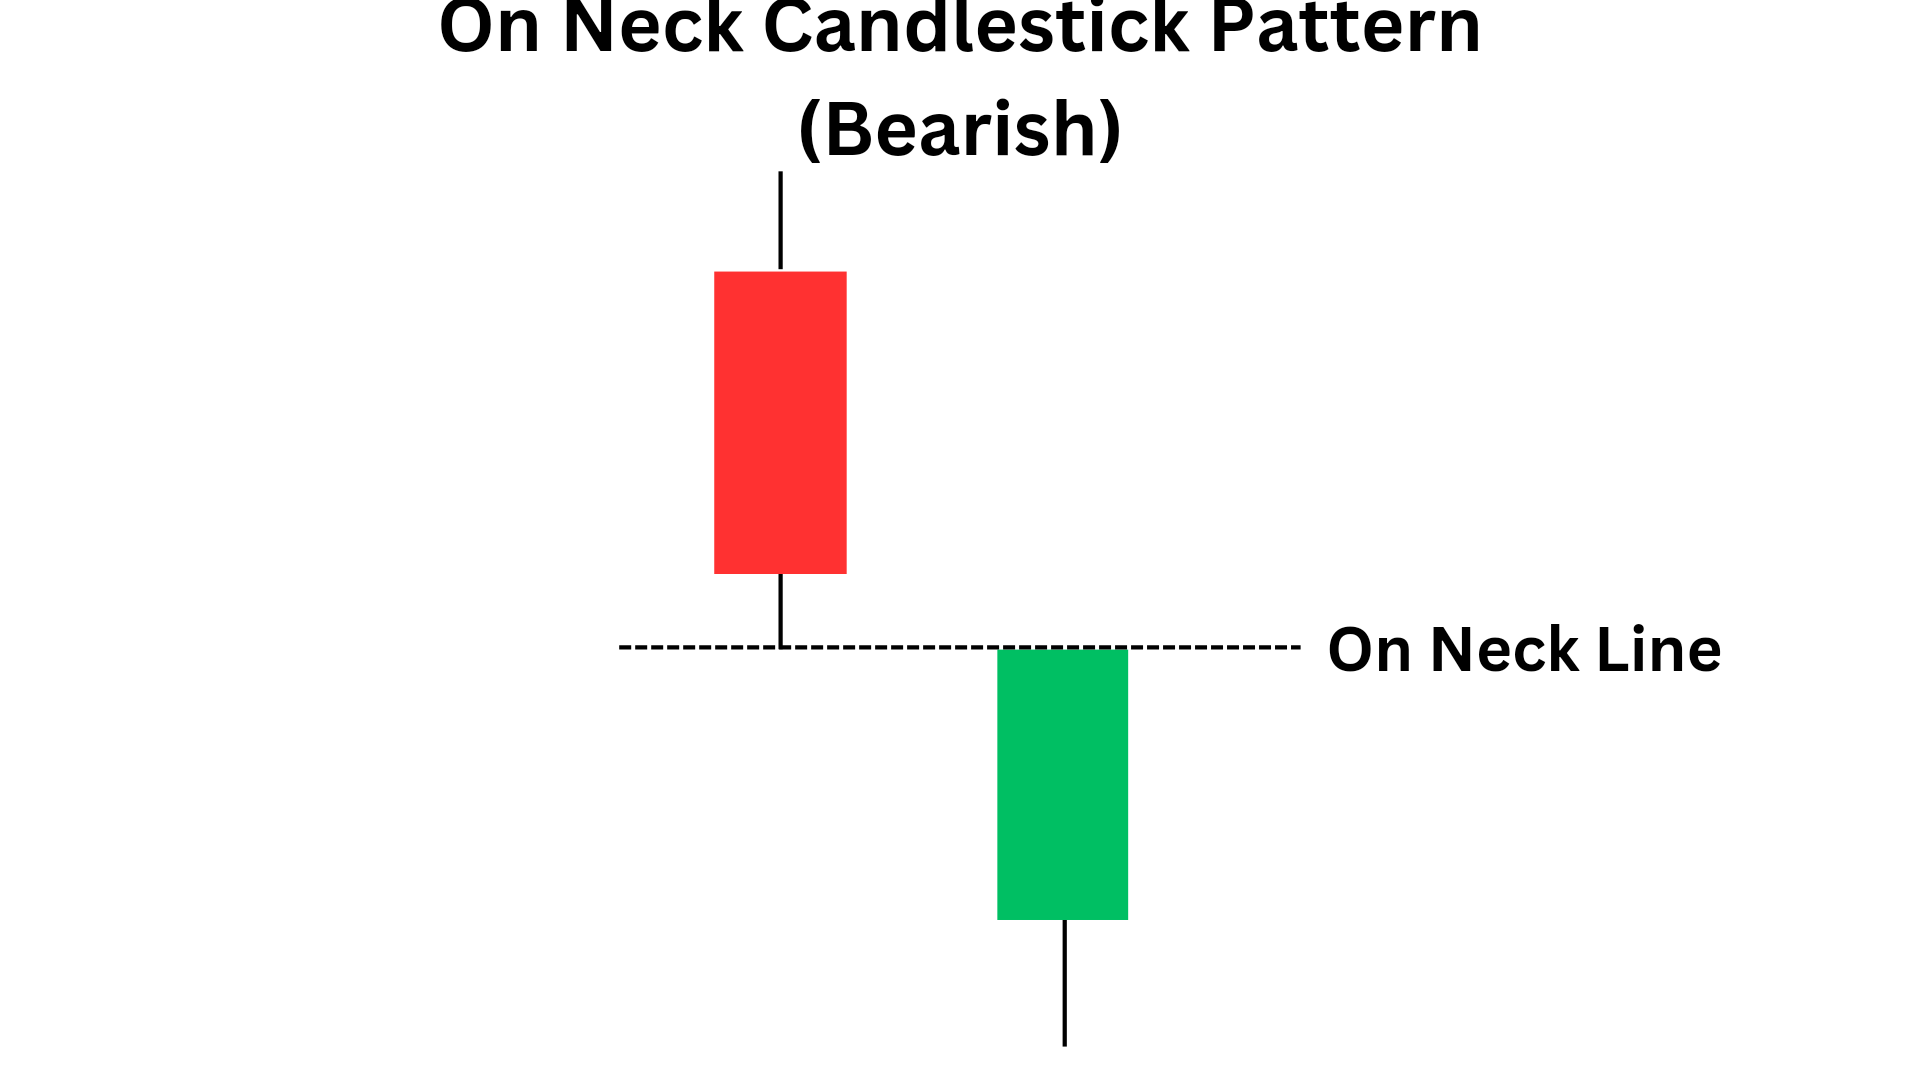
The On Neck Candlestick Pattern is a two candlestick bearish reversal pattern that appears at the end of an uptrend. It is formed by two candlesticks, the first one is a long bearish candles, followed by a bullish candle(can be of any size). The bullish(green or white) candle must get rejection at the low or the wick of the bearish(red or black) candle. Even if the green candle covers 20-25%of red candle , it will be considered ok to take trade.
Characteristics of On Neck Candlestick Pattern
The neck candlestick pattern has several characteristics that traders should be aware of:
On Neck Candlestick Pattern:
- It is formed at the end of an uptrend.
- The first candle is bearish followed by a bullsh candle (can be of any size).
- The red candle gets rejection at the high of the red candle.
- Start shorting the shares, when this candle is formed on the chart.
- It is a bearish reversal candlestick.
NOTE: It is important to note that even if the second candle of this pattern crosses the neck line by 20-25%, It will be also considered as on oneck candlestick pattern and it is also considered as a good signal to take trade.
The formation of the Neck Candlestick Pattern indicates that the bulls are losing control of the market, and the bears are taking over. It suggests that the buyers are no longer willing to buy at higher prices, and the sellers are entering the market, pushing the price down.
Top Bestseller mastermind book to learn trading from scratch along with examples click here.
Psycology of the On Neck Candlestick Pattern
1. At first, the trend was in upward which encouraged the bulls to buy positions and at the same time due to fear of loss sellers sold their position which suddenly increases the demand.
2. Then first red candle of On Neck pattern appeared at the top, it encouraged the sellers to short trade and bulls end their position in the fear of loss.
3. Then second green candle appears , it created a feeling of hope for bears, but when the price get rejection at the low of the bearish candle, it gave a clear confirmation to the sellers to sell shares and yltimately after that price starts moving in downward direction.
Success rate: It is said that on neck candlestick pattern has a success rate near to 50%, which means for every 2 trade take you will be able to make profit in one of them.
How To Trade On Neck Candlestick Pattern?
Following are the ways , in which one can trade using the neck candlestick pattern. It will surely help traders to enhance their trading skills and to make profit.
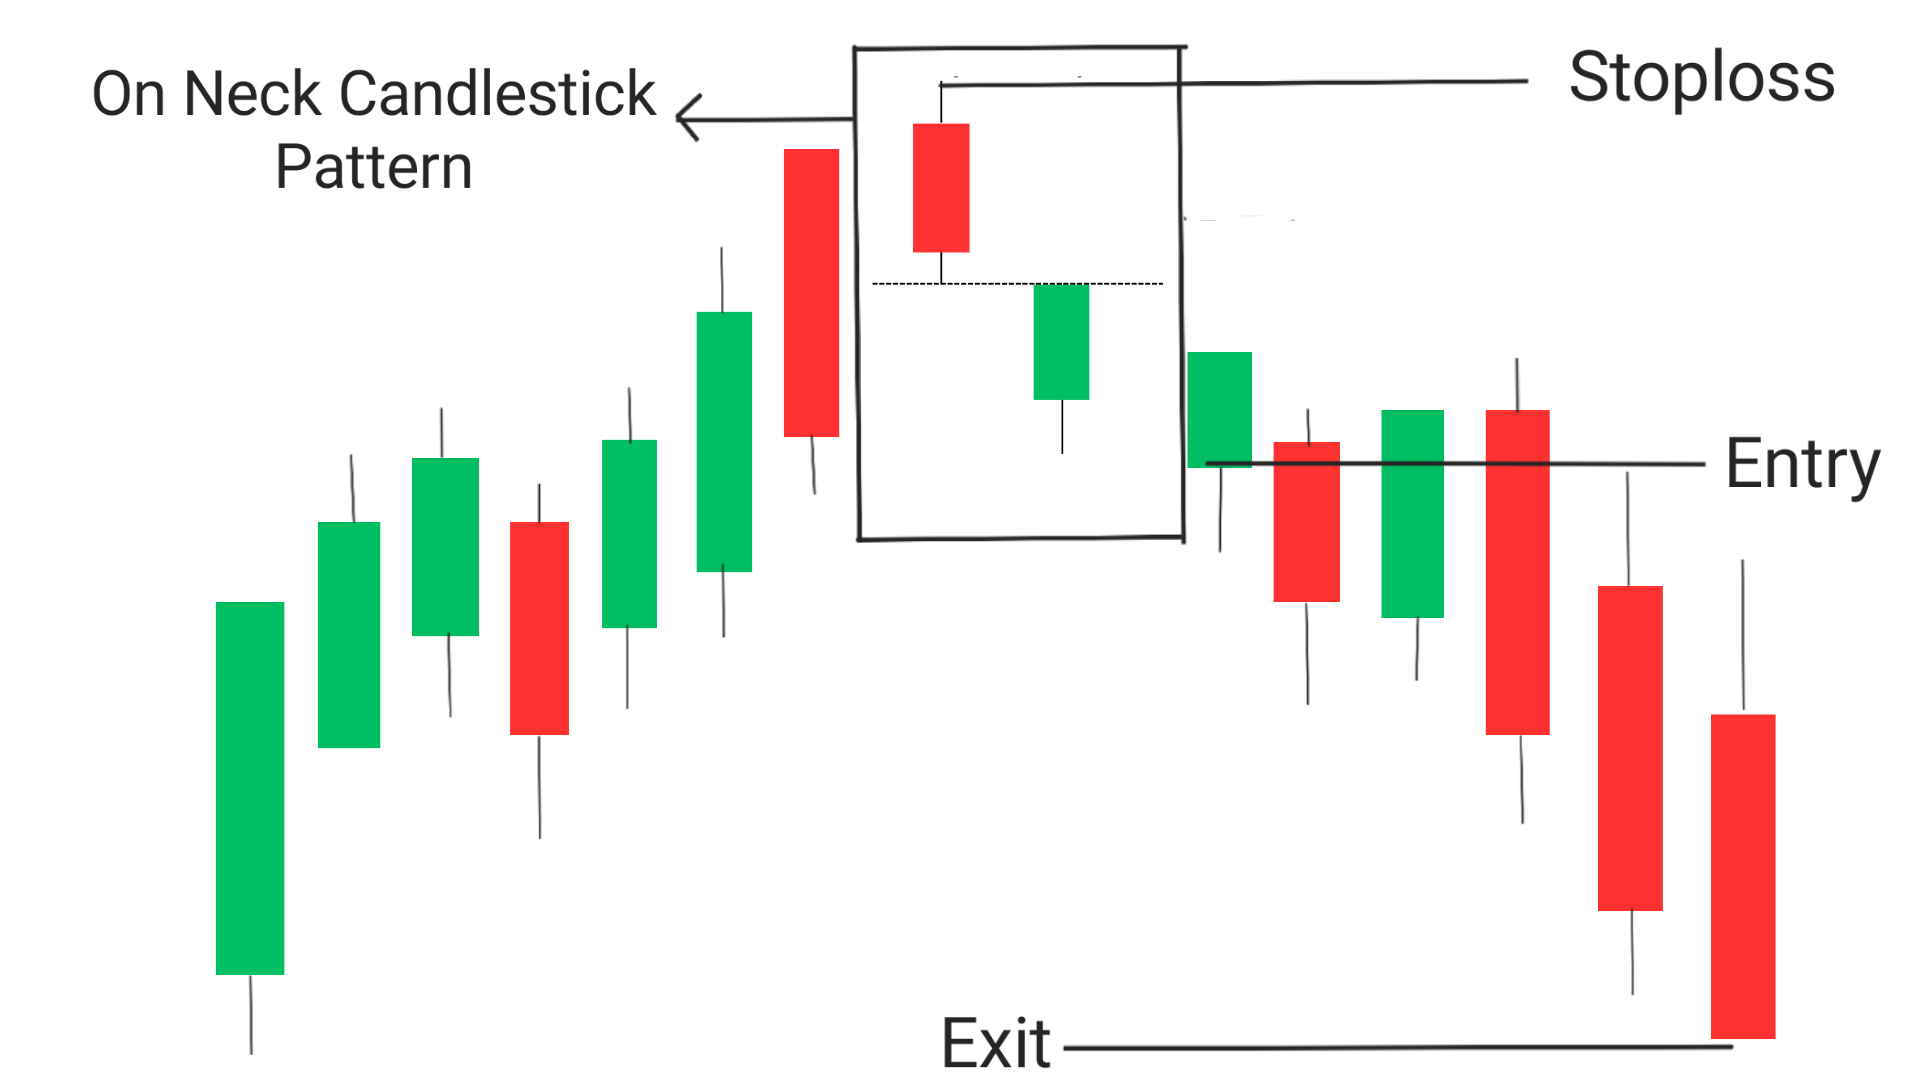
Entry : Entry must be taken when any candle closes below the low of the second candle of the on neck candlestick pattern.
Exit : Exit the trade when you found a reversal signal or when you reached a predetermined target or when price reaches a significant support level, if you want to trade more you can look for a real breakout near support level, if it happens then take another take upto next support level.
Stoploss : In order to minimise the risk of stoploss hitting, stoploss must be set at the high of on neck candlestick pattern.
Conclusion
The On Neck Candlestick Pattern is a two candlestick bearish reversal pattern that has potential to convert uptrend into downtrend. It consists of two candlesticks, the first is a long bullish candle followed by a small bearish candlestick that opens above the previous candlestick’s high and closes below its midpoint.
Frequently Asked Questions(FAQs)
1.What is on neck candlestick pattern?
The On Neck Candlestick Pattern is a two candlestick bearish reversal pattern that appears at the end of an uptrend. It is formed by two candlesticks, the first one is a long bearish candles, followed by a bullish candle(can be of any size). The bullish(green or white) candle must get rejection at the low or the wick of the bearish(red or black) candle. Even if the green candle covers 20-25%of red candle , it will be considered ok to take trade.
2.What is the bullish neckline pattern?
The bullish neckline pattern is a bullish continuation pattern that is formed during an uptrend. It consists of a series of candlesticks with small real bodies that are contained within the range of the previous day’s candlestick. This pattern indicates that buyers are still in control and that the uptrend is likely to continue.
3.Is the on neck candlestick pattern bullish or bearish?
The on neck candlestick pattern is bearish, not bullish.