Is head and shoulder pattern bullish? 5 FAQs
If you are a trader, you must have heard about the head and shoulder pattern. It consists of two shoulders and a head, With head being higher than the shoulders. It is a popular and reliable technical analysis tool that can help you identify potential trend reversals in the market. In this blog, we will discuss what the head and shoulder chart pattern is, how to identify it, and how to trade it.

What is the Head and Shoulder Chart Pattern?
The head and shoulder chart pattern is a bearish reversal chart pattern that forms after an uptrend. It is called a head and shoulder pattern because it looks like a head with two shoulders on either side. The pattern consists of three peaks, with the middle peak being the highest (the head) and the other two peaks being lower (the shoulders).
The head and shoulder chart pattern is a reliable indicator of a trend reversal because it shows that the buyers are losing momentum and the sellers are taking control of the market. When the price breaks below the neckline (the support level), it confirms the trend reversal, and traders can enter short positions.
This pattern remebles a man’s shoulders and head, It is also known as Three Buddhas pattern.
How Head and shoulder pattern is formed?
- Previous trend must be in uptrend.
- At a certain heigh price takes resistance and starts falling down. It creates the left shoulder of the pattern.
- After falling for some distance price takes support(support no.1) and rises again and breaks the previous resistance level and takes reistance at a price higher than the left shoulder.
- From the 2nd resistance price starts falling down and takes support at the same level where the first fall has taken resistance(This can vary 2-3% up/down than the 1st). thsi process creates the head of the pattern.
- From the standard resistance level, Price starts rising again and takes resistance at the same level where the high of first shoulder has taken resistance. From this level price starts dalling down, creating the right shoulder.
Key features of Head and Shoulder Pattern
- The head will be always higher than the shoulders.
- In general, The volume at the left shoulder is higher than the head and right shoulder.
- When price starts falling in the right shoulder volume also starts increasing.
- There must be atlest gap of 7-8 candles between a shoulder and the head. if the gap is less than 7 then it won’t be considered as a valid head and shoulder pattern.
- This pattern can be formed in any time frame and can work properly.
- The chart give a proper idea regarding how many candles or time should be between the head and the shoulders.
-
Type Of Investment Gap Between Two highs Intraday Chart 7-8 Candles Gap Short Term 3-4 Weeks Gap Medium Term 3-4 Months Gap Long Term 1-2 Years or more
How to Identify the Head and Shoulder Chart Pattern?
Identifying the head and shoulder chart pattern is relatively easy. Here are the steps to follow:
Step 1: Look for an uptrend in the market.
Step 2: Identify the left shoulder, which is formed when the price rises to a peak, followed by a decline.
Step 3: Identify the head, which is formed when the price rises to a higher peak than the left shoulder, followed by a decline.
Step 4: Identify the right shoulder, which is formed when the price rises to a peak lower than the head, followed by a decline.
Step 5: Draw a neckline, which connects the lows of the left shoulder and the right shoulder.
Step 6: Wait for the price to break below the neckline to confirm the trend reversal.
How to Trade the Head and Shoulder Pattern?
Once you have identified the head and shoulder chart pattern, you can trade it using the following steps:
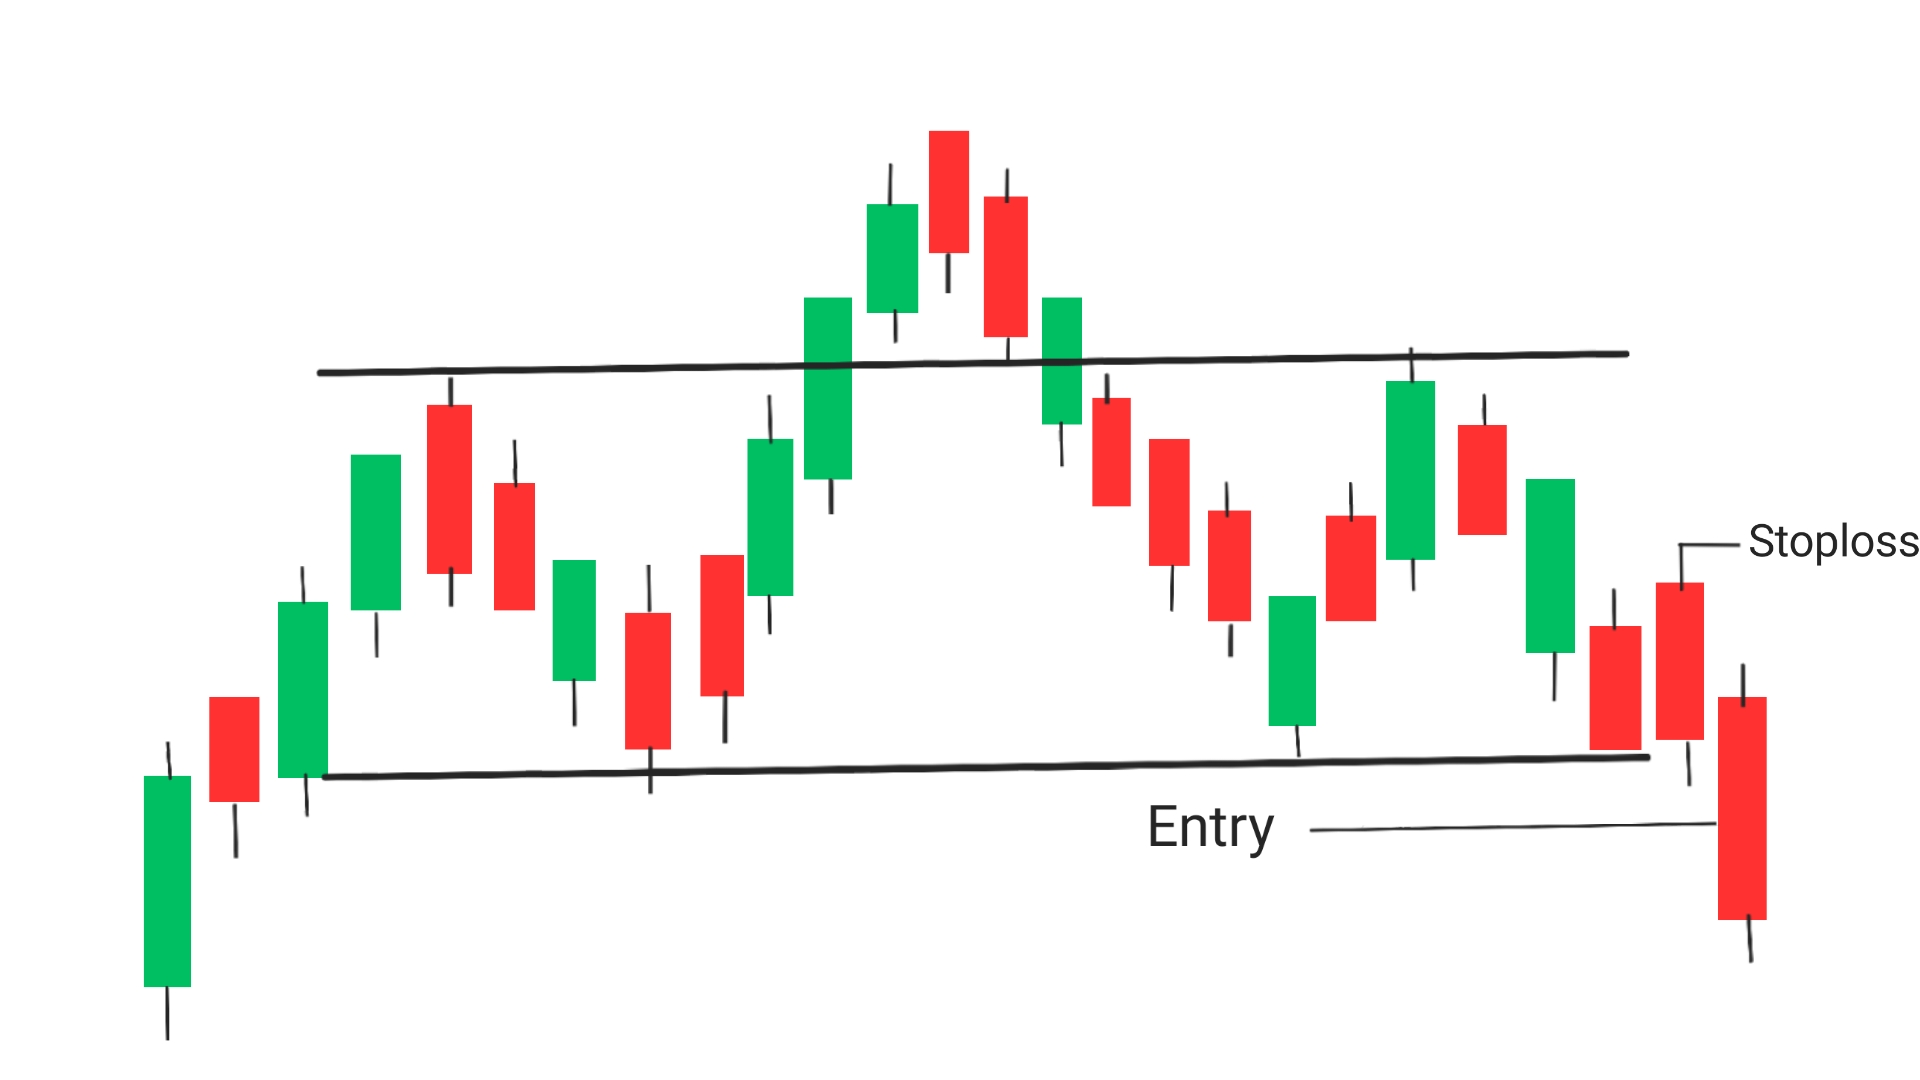
Draw a trendline: Draw a trendline touching both the resistance level,
Entry point: Enter a short position from the next canddle which breaks the this trendline
Stoploss: Set stoploss at the high of the candle previous to the csndle which breaks the trendline. the differenc between the entry and the stoploss must be according to the 2% rule of risk reward raitio
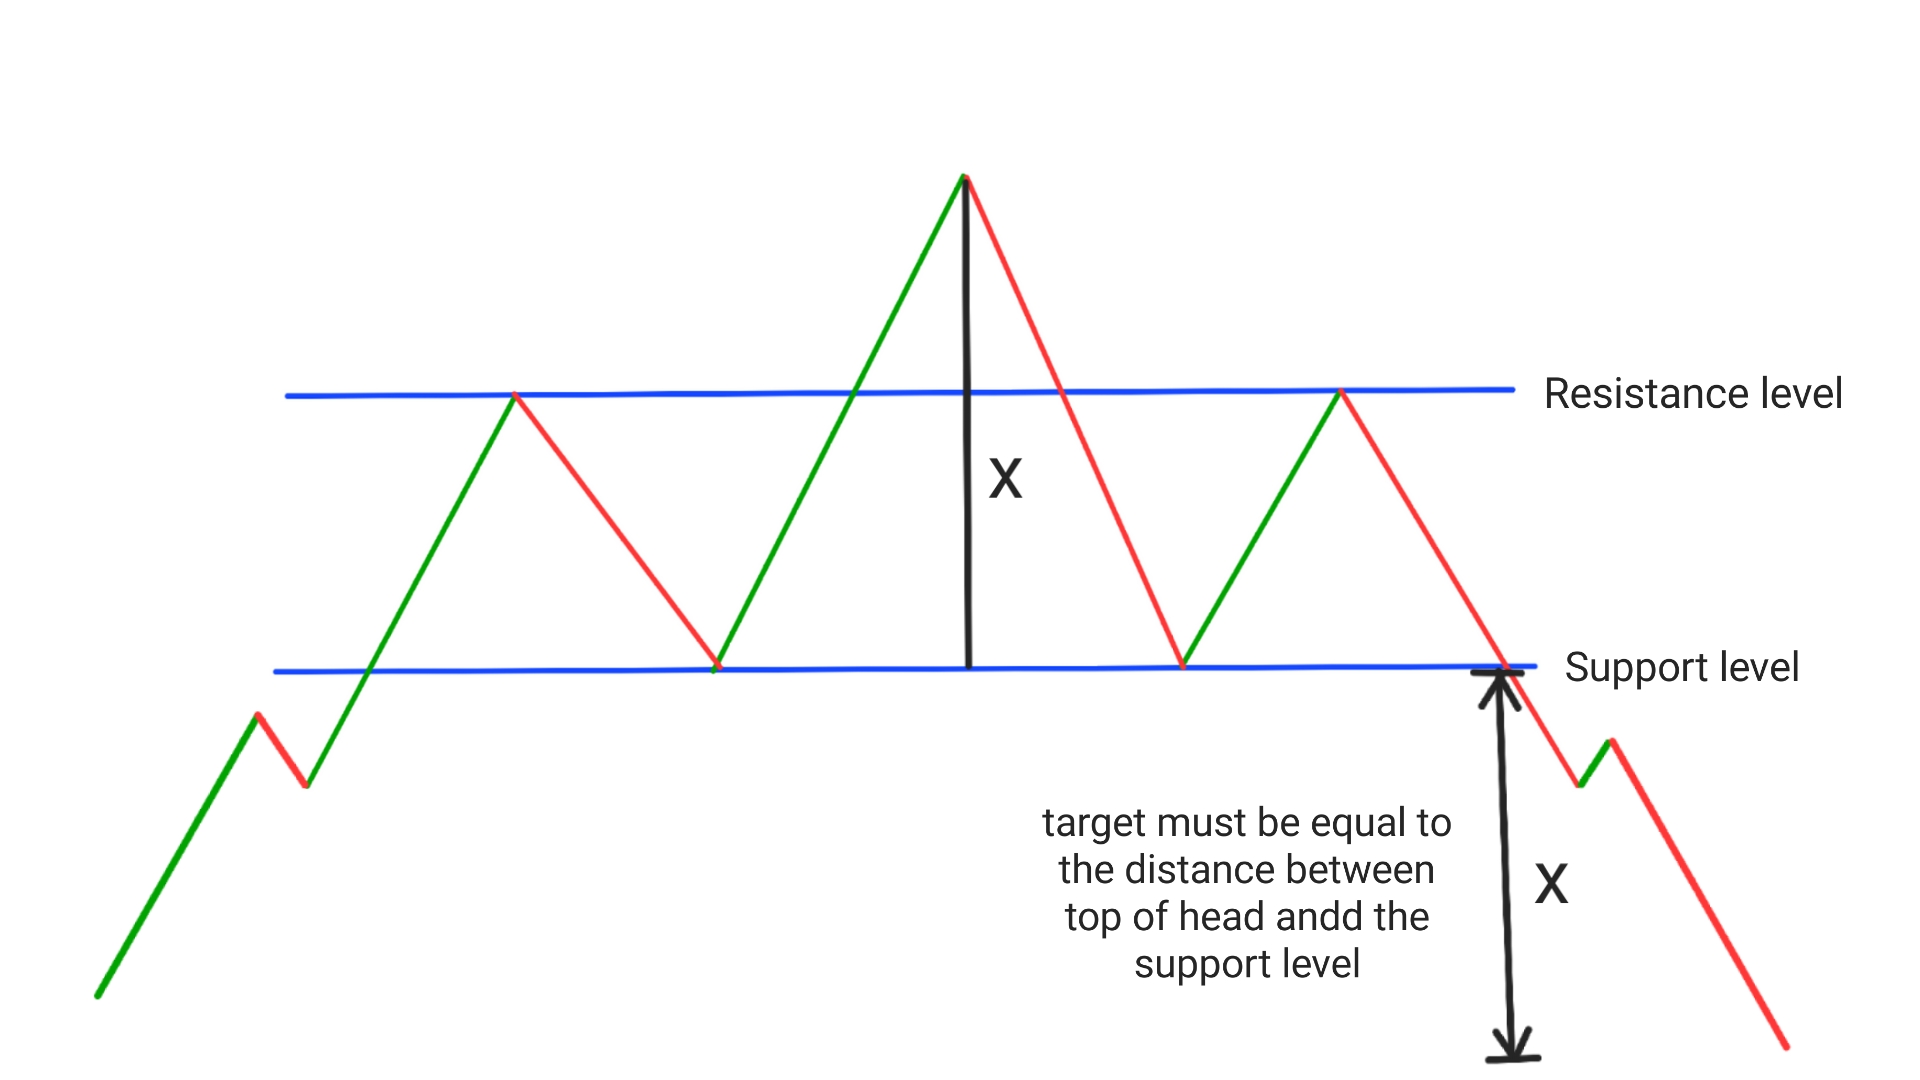
Head and Shoulder Pattern Target: Book profit when price has covered a distance equal to the distance between the high of the head and the trendline.
General steps are as follows:
Step 1: Enter a short position when the price breaks below the neckline.
Step 2: Place a stop loss above the right shoulder.
Step 3: Set your profit target based on the distance between the head and the neckline.
Step 4: Monitor the trade and adjust your stop loss and profit target as necessary.
For more example
Conclusion
The head and shoulder pattern is a reliable tool for identifying trend reversals in the market. It is easy to identify and can be traded using simple strategies. With proper entry , entry and stoploss points one can easily make profit using head and shoulder pattern, With target equal to the distance between the top of he head and the support level below the support level.
Frequently Asked Questions (FAQs)
1.Why is head and shoulder pattern bearish?
The head and shoulder pattern is bearish because it signals a potential trend reversal from an uptrend to a downtrend. It is formed by three peaks, with the middle peak (the head) being higher than the two surrounding peaks (the shoulders), creating a neckline that acts as a support level. When the neckline is broken, it indicates that the bulls have lost control and the bears are taking over.
2.How accurate is head and shoulders pattern?
The accuracy of the head and shoulders pattern is bearly 90%, Which means for every 10 trades based on head and shoulder pattern one can easily book profit in 9 out of those 10 trades.
3.How do you predict head and shoulders pattern?
To predict a head and shoulders pattern, traders look for three peaks forming in an uptrend, with the middle peak being higher than the other two. They also look for a neckline that connects the lows between the peaks. Once the neckline is broken, traders can enter a short position with a stop loss above the right shoulder.
4.Which stock pattern has the highest accuracy?
Cup and handle is one the pattern which has the highest accuracy nearly 90%. It can help traders in making huge profit soleny based on cup and handle pattern.
5.Is head and shoulder pattern bullish?
No, The head and shoulder pattern is a beraish chart pattern, It ha sthe potential to convert uptrend into downtrend. This Pattern can work in any time frame.
1 thought on “Is head and shoulder pattern bullish? 5 FAQs”