Inverted hammer Candlestick
The inverted hammer candlestick pattern is one the pattern, i.e. widely used in technical analysis to identify a potential bullish reversal in the market trend. After reading this guide you will have a clear understanding about inverted hammer candlestick pattern.
What is inverted hammer?
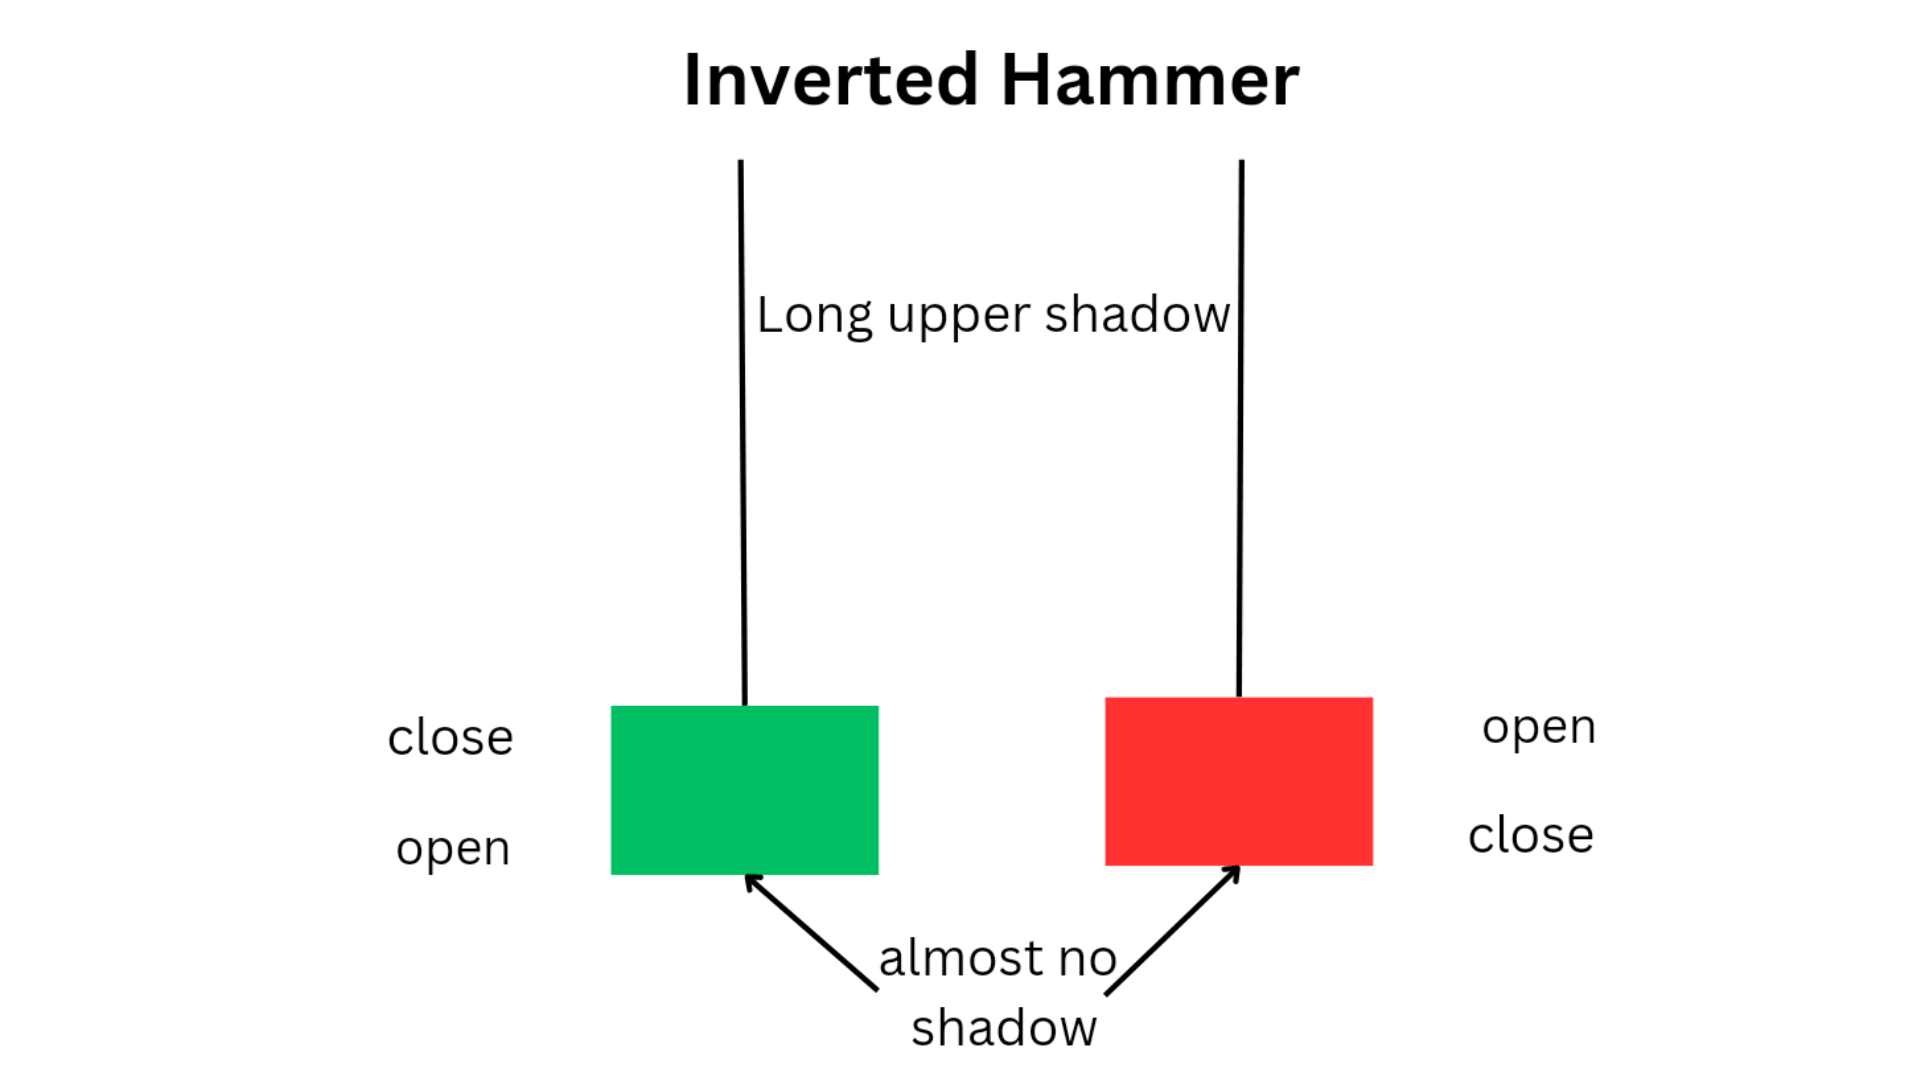
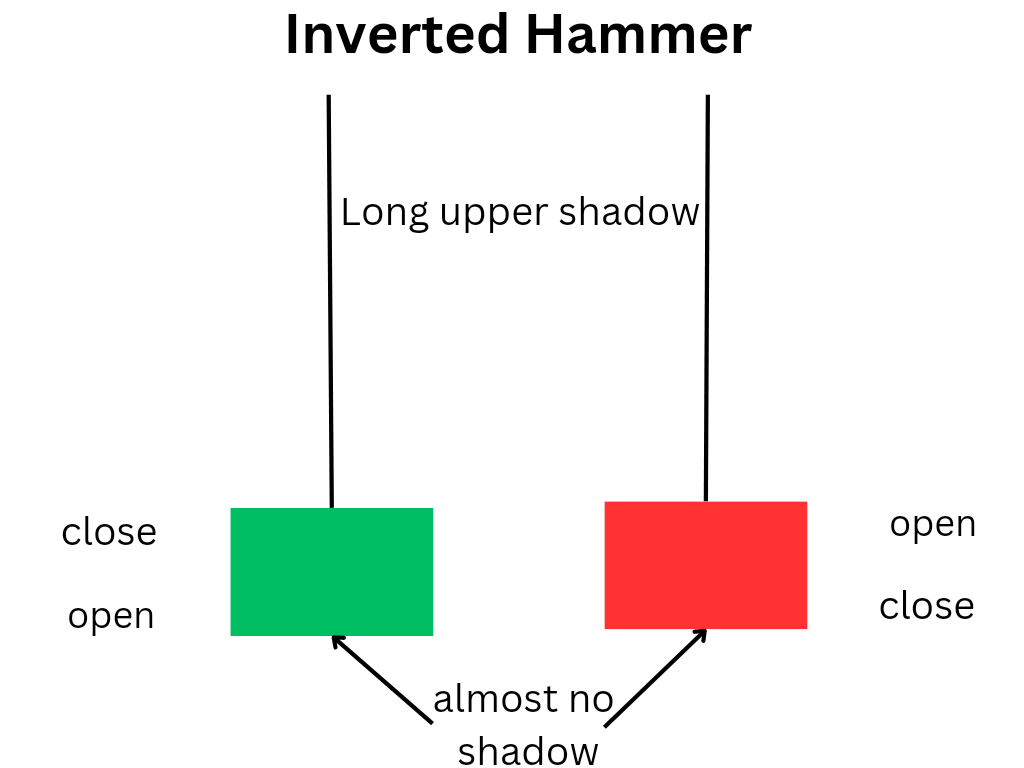
Inverted Hammer candlestick is a single candlestic pattern, known for bullish trend reversals whenever formed at bottom of a downtrend. it has a small bodyand long shadow or wick. This pattern is formed when the opening and closing price of an asset is almost identical. The shape resembles an upside down hammer , therefore it is termed as ‘Inverted Hammer’.
This pattern can be classified into two types:-
1. Green inverted hammer
2. Red inverted hammer
learn all the candlestick pattern at one place do check this best book from here. for more candlestick related content do visit moneyinspires.
One by one we will go through these two candlestick and will provide you with all the necessary details.
1.Green Inverted Hammer
Green inverted hammer is a bullish reversal candlestick pattern that suggests a potential market reversals when formed at bottom of downtrend. Traders use this pattern as a technical indicator other technical indicators to validate potential buying opportunities.

How does green inverted hammer looks like?
• This pattern contains a small body at the top of the candlestick.• It has a long lower wick, resembling an upside-down hammer.
• It indicates a bullish reversal when this pattern is formed at the bottom or end of a downtrend.
• This pattern suggest that buyers are ready to take charge from sellers and the price is ready to move upward.
• Green Inverted hammer is formed when the opening and closing prices are near the top of the trading range.
• while the lower wick extends significantly lower, indicating that there was a strong push downwards during the trading session.
• This pattern suggests that despite the bearish pressure, buyers were able to push the price back up, creating a long lower wick and closing near the high of the session.
Significance of green inverted hammer?
The green inverted hammer can be a useful tool for traders looking for buying opportunities in a downtrend. However, it is important to remember that no single pattern or indicator can give clear idea of market movements, and it is essential to use the green inverted hammer along with other technical indicators.
The green inverted hammer is a bullish candlestick pattern that can indicate potential market reversals in a downtrend. Traders use this pattern with other technical indicators and market analysis tools to validate potential buying opportunities. By understanding the characteristics and significance of the green inverted hammer, traders can take decisions more precisely and make profit.
Red Inverted Hammer
Are you looking for a powerful tool to help predict potential market reversals in a downtrend? Look no further than the red inverted hammer candlestick pattern. This popular candlestick pattern is widely used in technical analysis to identify potential buying opportunities in a downward market trend.
How does red inverted hammer candlestick look like?
• The red Inverted hammer has a small body at the bottom of the candlestick.
• It has a long upper wick, resembling an upside down hammer.
• When this pattern appears at the bottom of a downtrend it may convert downtrend into uptrend.
• It is often seen as a bullish signal, suggesting that buyers(bulls) are ready to dominate the market and the price will move upwards.
how red inverted hammer is formed?
This pattern is formed when the opening and closing prices are near the bottom of the price chart, while the upper wick extends significantly higher, indicating that there was a strong push upwards during the trading session. This suggests that despite the bearish pressure, buyers were able to push the price back up, creating a long upper wick and closing near the low of the session.
How to trade inverted hammer candlestick?
ENTRY: if inverted hammer is formed at the support level, it is a sign that price may move upward, remember: it is a sign not a confirmation. To make it stronger you can use indicators like trebdline, vwap, rsi .
EXIT: when this price movement reaches the resistance level you can exit the trade , if you want to trade more then look for actual breakout. After breakout your resistance will act as a support level and you can maximise tour profit.
STOPLOSS: Your stoloss order should be the bottom price of the inverted hammer , and take trade from the candle next to inverted hammer, this will reduce the chance of stoploss hitting.
the inverted hammer is a valuable tool for traders looking to identify potential buying opportunities in a downtrend. By understanding the characteristics and significance of this pattern, traders can make precise decisions and manage risk effectively in their trading sessions.
2 thoughts on “Inverted hammer candlestick: definition, 2 types, trading strategy”