How To Trade Triple Top Pattern?
As a trader, it is important to have a good understanding of the different chart patterns that can help you make informed trading decisions.
One such pattern is the Triple Top Pattern, which is a popular chart pattern among traders. In this blog, we will take a closer look at the Triple Top Pattern, what it is, how to identify it, and how to trade it.

What is a Triple Top Pattern?
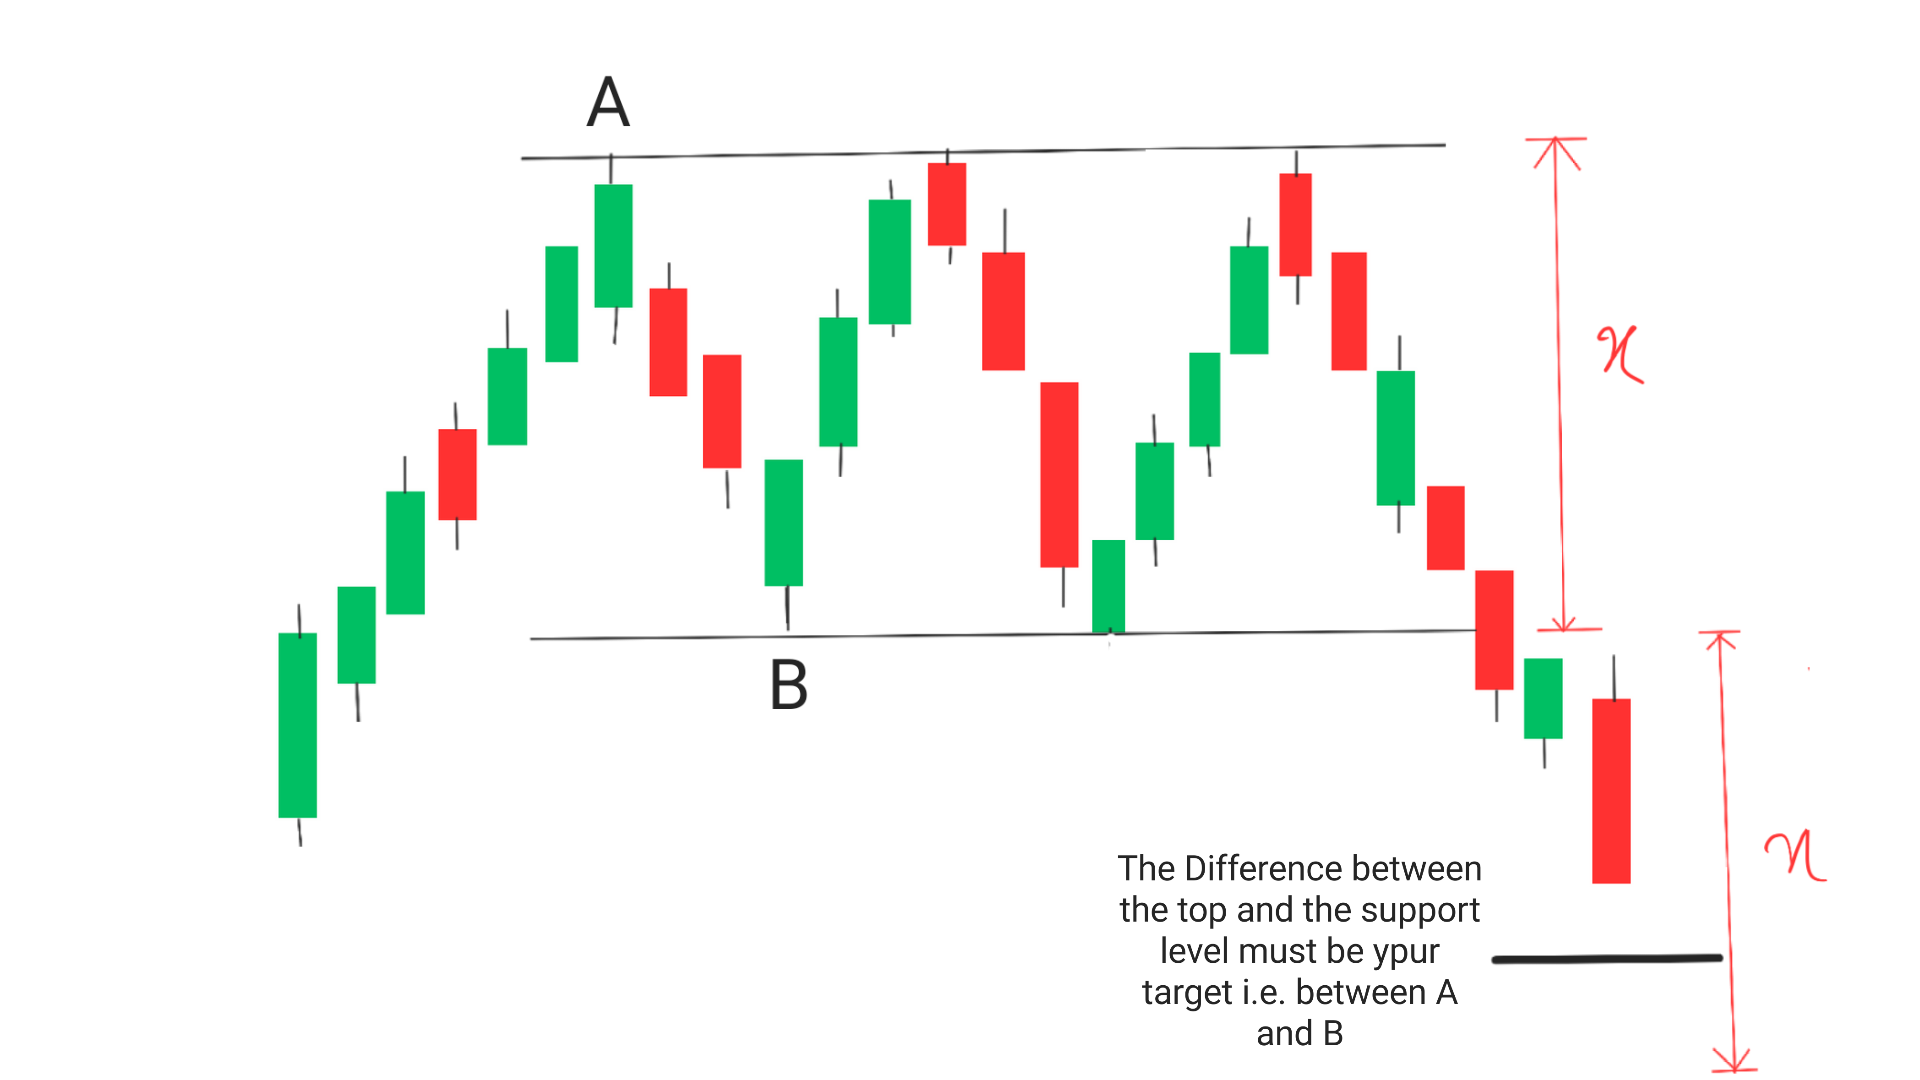
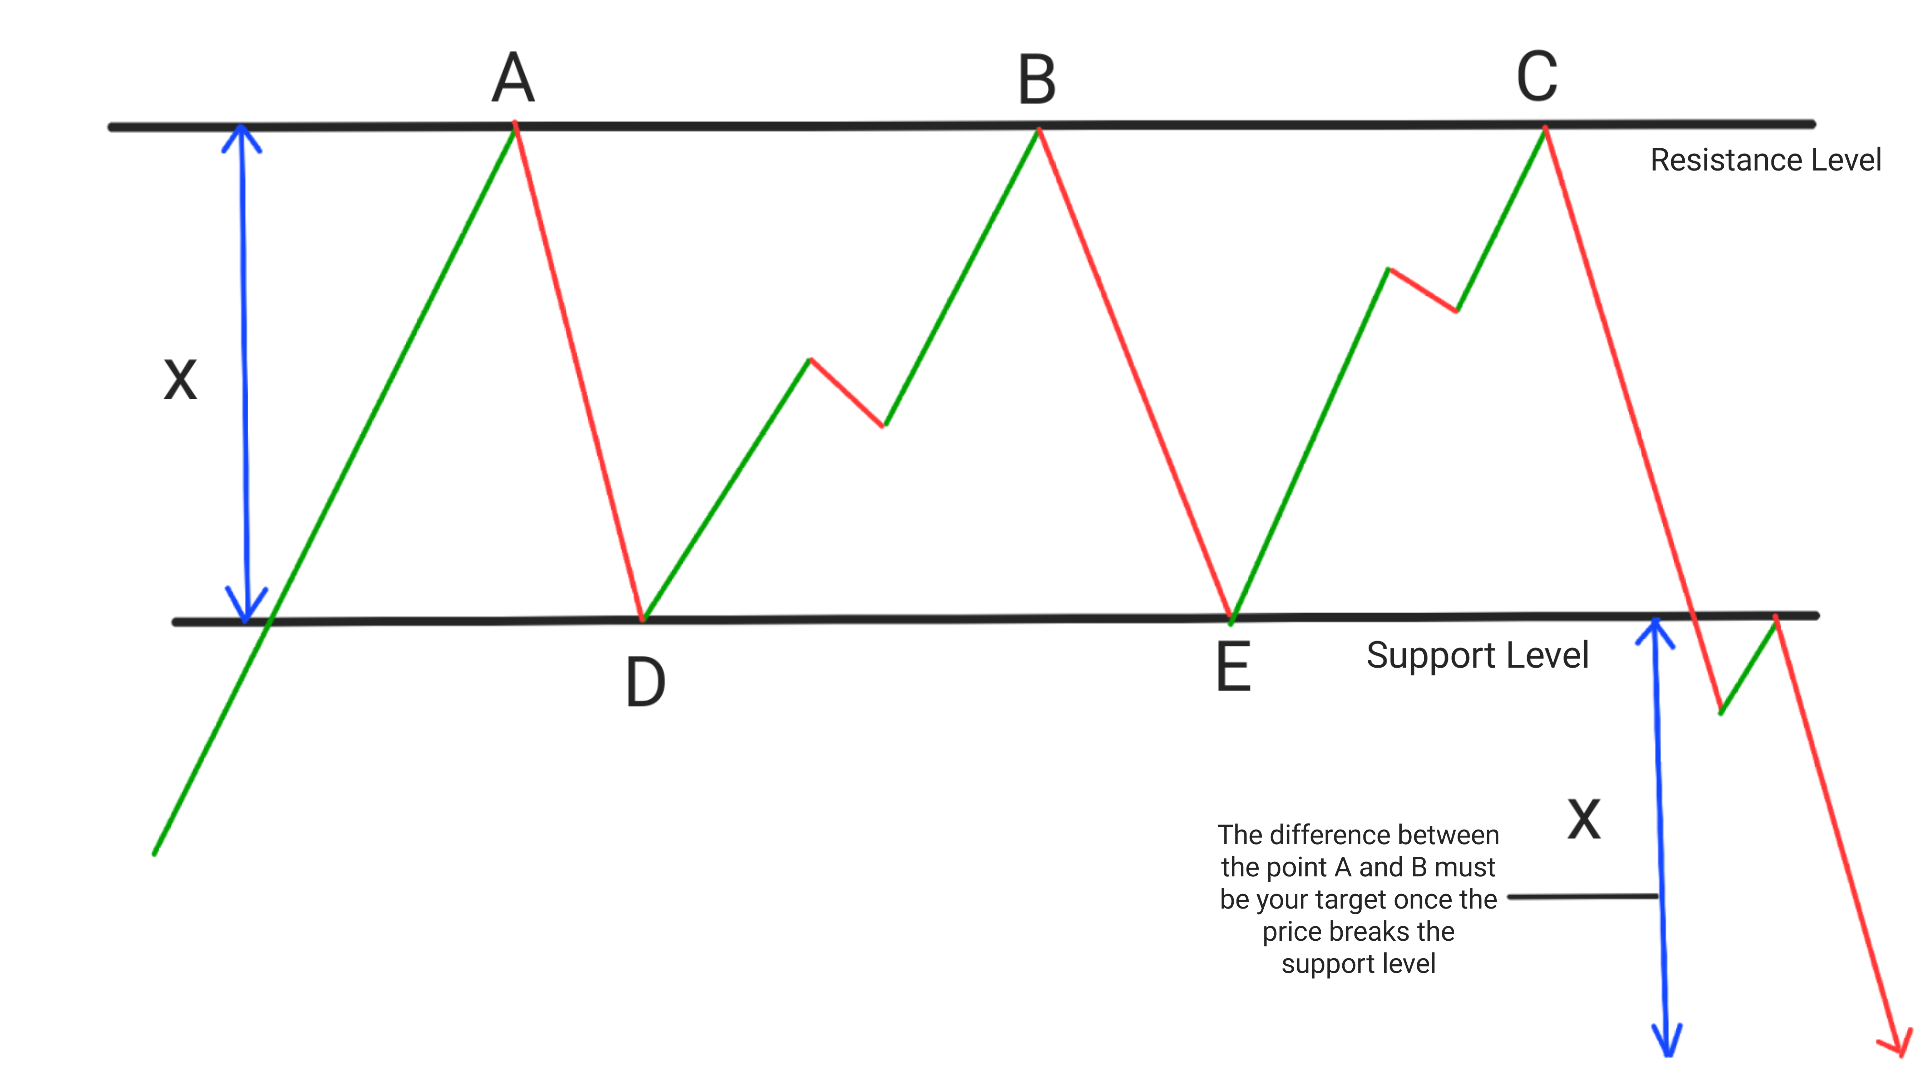
The Triple Top Pattern is a bearish reversal chart pattern(It can convert uptrend into downtrend) that forms after an uptrend. It is known for having three peaks of almost equal heights, followed by a break below the support level. This pattern indicates that the market has reached a resistance level and is unable to break through it, leading to a reversal in trend. This pattern is also known as ‘Three Mountain‘.
Identifying the Triple Top Pattern
To identify the Triple Top Pattern, you need to look for three peaks that are almost equal in height.
These peaks should be separated by two valleys, with the middle valley being lower than the other two.
The resistance level is formed by connecting the highs of the three peaks, and the support level is formed by connecting the lows of the two valleys.
In depth analysis of Triple Top Pattern
- Previous trend must be in uptrend.(At the beginning)
- It is necessary that the first high of the pattern shold also be the highest point of the uptrend.
- From the high price takes resistance and starts falling nearly about 10%-20% of the total uptrend
- the price then moves sideways for a few time then takes a support level and again starts rising.
- Price again takes resistance level at the same level.(This can vary in between 2%-3%)
- The volume at the second top is lower than the first top.
- Price then again falls and takes support at the same support level like previous one. ( If this support level is equal or higher than the previous trend then it is considered to be a good signal).
- From the support level price starts rising for the 2nd time and takes the same resistance level(this can be upto 3%up/down).
- At the last the price starts going down, Breaks support level and keep going down and set a target distance equal to the difference of points between support and resistance level .
- There must be atlest 7-8 candles between two consecutive highs.
| Type Of Investment | Gap Between Two highs |
|---|---|
| Intraday Chart | 7-8 Candles Gap |
| Short Term | 3-4 Weeks Gap |
| Medium Term | 3-4 Months Gap |
| Long Term | 1-2 Years or more |
How To Trade Triple Top Pattern?
The triple top chart pattern is a bearish reversal pattern that occurs when the price of an asset creates three consecutive peaks at approximately the same price level, followed by a downward move. Trading this pattern involves identifying the formation of the pattern and taking a short position on the asset. For example you can visit here.
1. Identify the lows: Look for two consecutive lows and draw a trend line touching the both lows, It will act as support for them at approximately the same price level.
2. Confirm the pattern: Confirm the pattern by looking for high trading volume during the formation of the pattern, and by waiting for the price to break below the support level created by the pattern.
3. Triple Top Pattern Entry:Enter a short position from the next candle which Breaks the price breaks the support level. You Must use a stop above the high of the candle previous to the breaking candle.
NOTE: Risk Reward Ration-The difference between the point of Buying and the stoploss must be according to the 2% rule of Risk Reward Ratio. If this rule does’nt follows then font take the trade.
4. Set a profit target: Set a profit target based on the height of the pattern. You can calculate this by measuring the distance between the support level and the highest point of the pattern, and adding this distance to the breakout point.
5. Monitor the trade: Monitor the trade closely to ensure that it is going according to plan. If the price starts to rising resistance level, consider closing your position to limit your losses.
NOTE: Remember to always use proper risk management techniques when trading any pattern, and to only trade with money that you can afford to lose. By following these steps, you can potentially profit from a bullish reversal in the market.
What Should be the Triple Top Pattern Target?
The target for the triple top pattern must be the equal to the distance between the support and the resistance level, Which will be calculated once iTriple top pattern gives breakout at support level.
Conclusion:
The Triple Top Pattern is a reliable chart pattern among traders, and it can be used for decades to make informed trading decisions. By identifying this pattern, traders can go short or sell when the price breaks below the support level, with a stop loss above the resistance level and a profit target at distance between the support level and resistance level. With a good understanding of this pattern, traders can improve their trading strategies and make more profitable trades.
Frequently Asked Questions(FAQs)
1.Is triple top pattern bullish or bearish?
Bearish,The Triple Top Pattern is a bearish reversal pattern.
2.How accurate is triple top pattern?
The accuracy of triple top pattern is near about 80%, Which means for every 5 trades taken you will make profit in 4 out of those 5.
3.What is the triple top price pattern?
The Triple Top Price Pattern is a bearish reversal pattern that forms after an uptrend. It is characterized by three peaks of almost equal heights, followed by a break below the support level.
4.What is the 3 touch rule in trading?
The 3 touch rule in trading refers to the idea that a support or resistance level is confirmed when the price touches it three times. This can help traders identify key levels and make informed trading decisions.
5.How bearish is a triple top?
A Triple Top Pattern is considered quite bearish as it indicates that the market has reached a resistance level and is unable to break through it, leading to a reversal in trend.
1 thought on “How To Trade Triple Top Pattern? Example With 5 FAQs”