High Wave Candlestick: A Comprehensive Guide
When it comes to technical analysis in trading, candlestick patterns comes out to be one of the most reliable indicator. One such pattern is the high wave candlestick, which is a type of candlestick that can signal a potential trend reversal or continuation. In this blog, we will delve into the high wave candlestick, its characteristics, and how to interpret it.

What is a High Wave Candlestick?
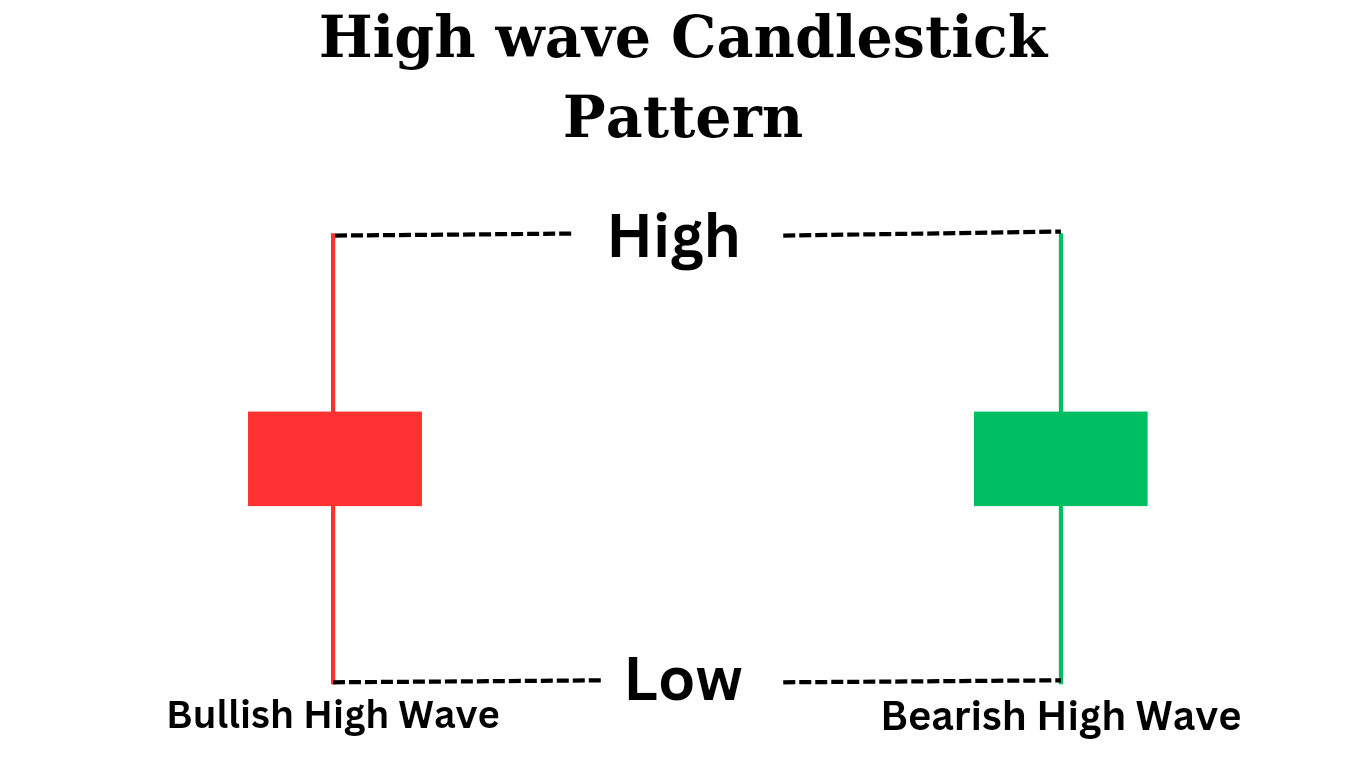
A high wave candlestick is a single candlestick pattern that has a long upper and lower shadow with a small real body. The real body represents the difference between the opening and closing price of an asset. The shadows, on the other hand, represent the highest and lowest prices reached during the trading period.
The high wave candlestick is often seen as a sign of indecision in the market. It shows that buyers and sellers are both active but are unable to take control of the market. This can lead to a potential reversal or continuation of the current trend. In simple words it is bearish and bullish reversal as well as bearish and bullish continuation pattern.
Characteristics of a High Wave Candlestick
The high wave candlestick has several characteristics that traders should be aware of:
1. Small Real Body: The real body of a high wave candlestick is small compared to the size of its shadows or wicks. This indicates that there is little difference between the opening and closing price of the asset.
2. Long Shadows: The shadows of a high wave candlestick are long, indicating that there has been significant price movement during the trading period.
3. Indecision: The high wave candlestick is often seen as a sign of indecision in the market, as neither buyers nor sellers have been able to take control.
Top Bestseller mastermind book to learn trading from scratch along with examples click here.
Interpreting a High Wave Candlestick
When interpreting a high wave candlestick, traders should look at the context in which it appears. If it appears after a strong uptrend or downtrend, it can potentially signal a potential trend reversal. Conversely, if it appears during a consolidation phase, it will indicate a continuation of the current trend.
Traders should also look at other technical indicators and price action to confirm their interpretation of the high wave candlestick. For example, if the high wave candlestick appears at a key support or resistance level, it could be a stronger signal of a potential trend reversal.
How To Trade High Wave Candlestick?
The high wave candlestick pattern is a single candlestick that has a long upper and lower shadow and a small real body. This pattern suggests indecision in the market, with both buyers and sellers trying to take control but ultimately failing to do so. Here are some steps to trade the high wave candlestick pattern:
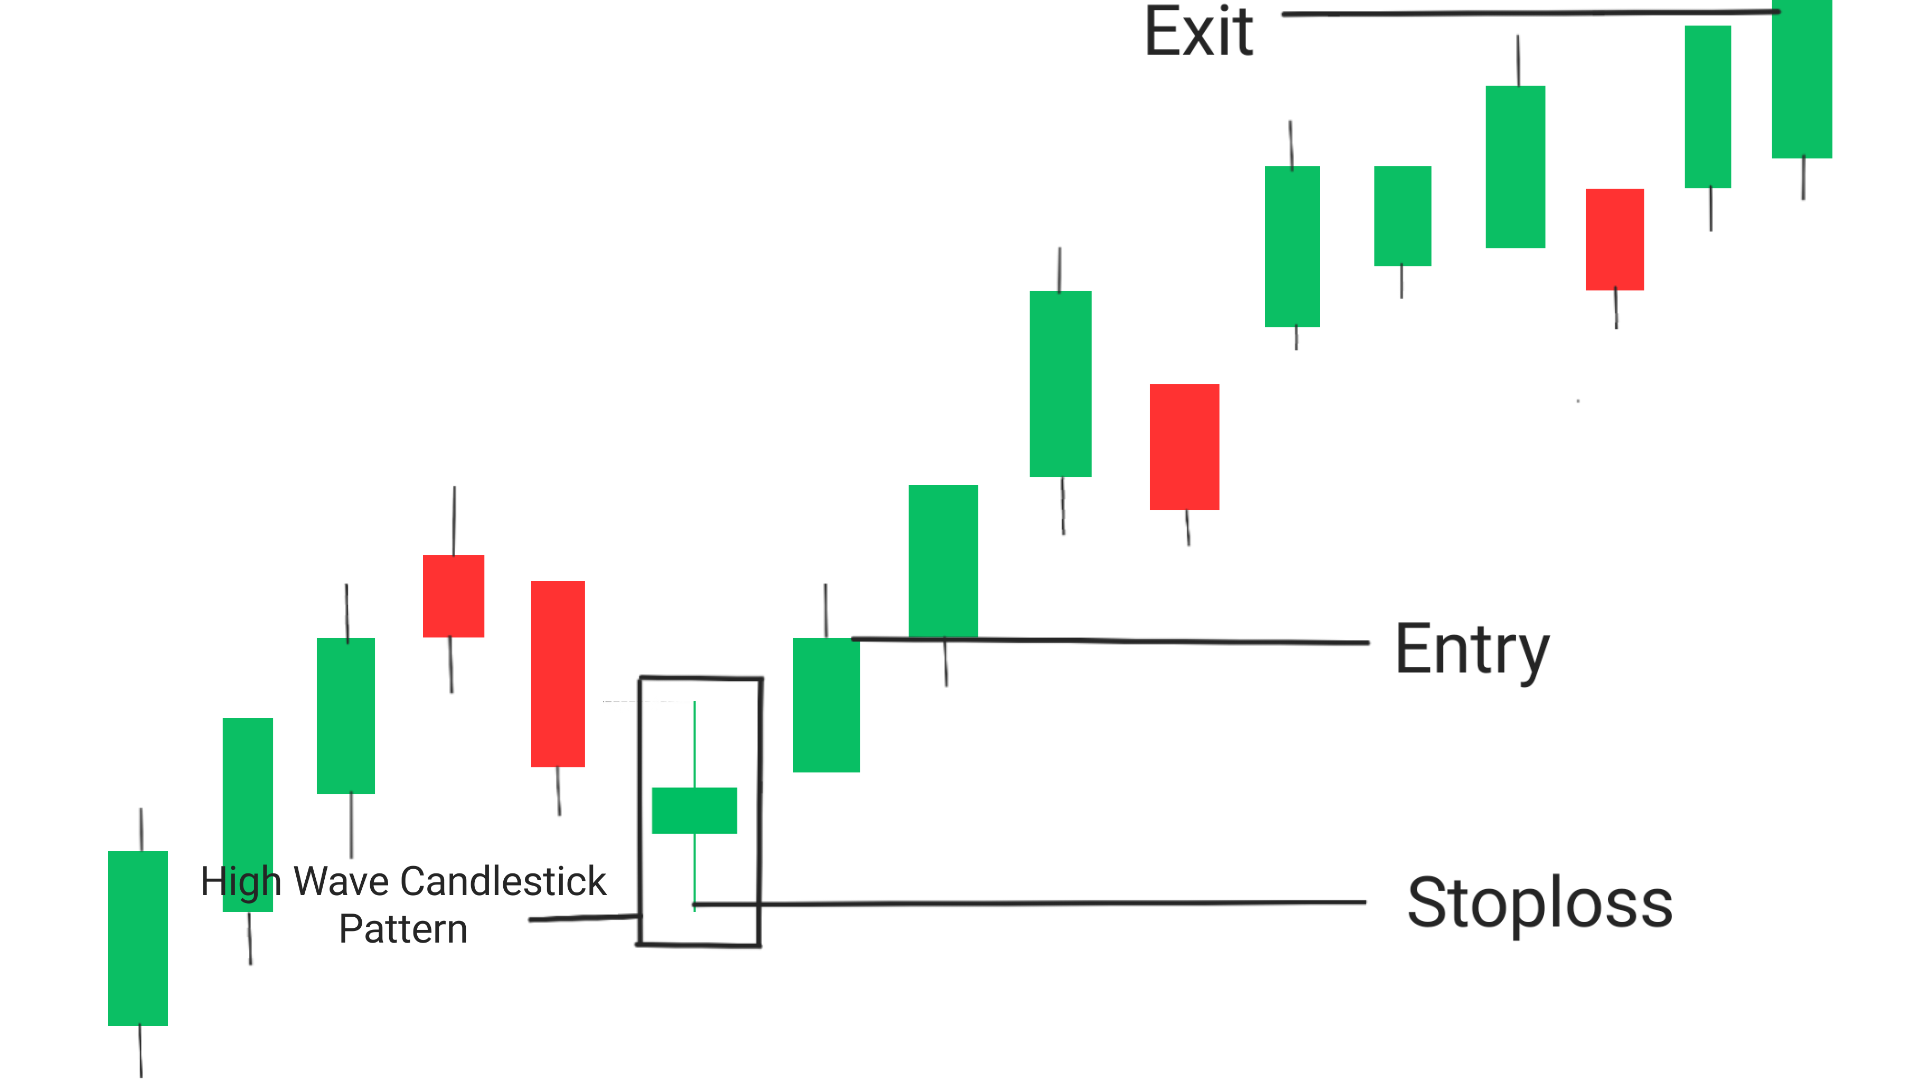
Entry: The best entry point is the from the next candle which breaks the high of the candlestick pattern.
Exit: Exit the trade if you have achieved your goal or if the price has reached a significant resistance level, If you want to trade more then you can look for a real breakout near resistance level if it happens then take another trade upto next resistance level.
Stoploss: In order to minimize the risk of stoploss hitting, Stoploss must be set at the low of high wave pattern.
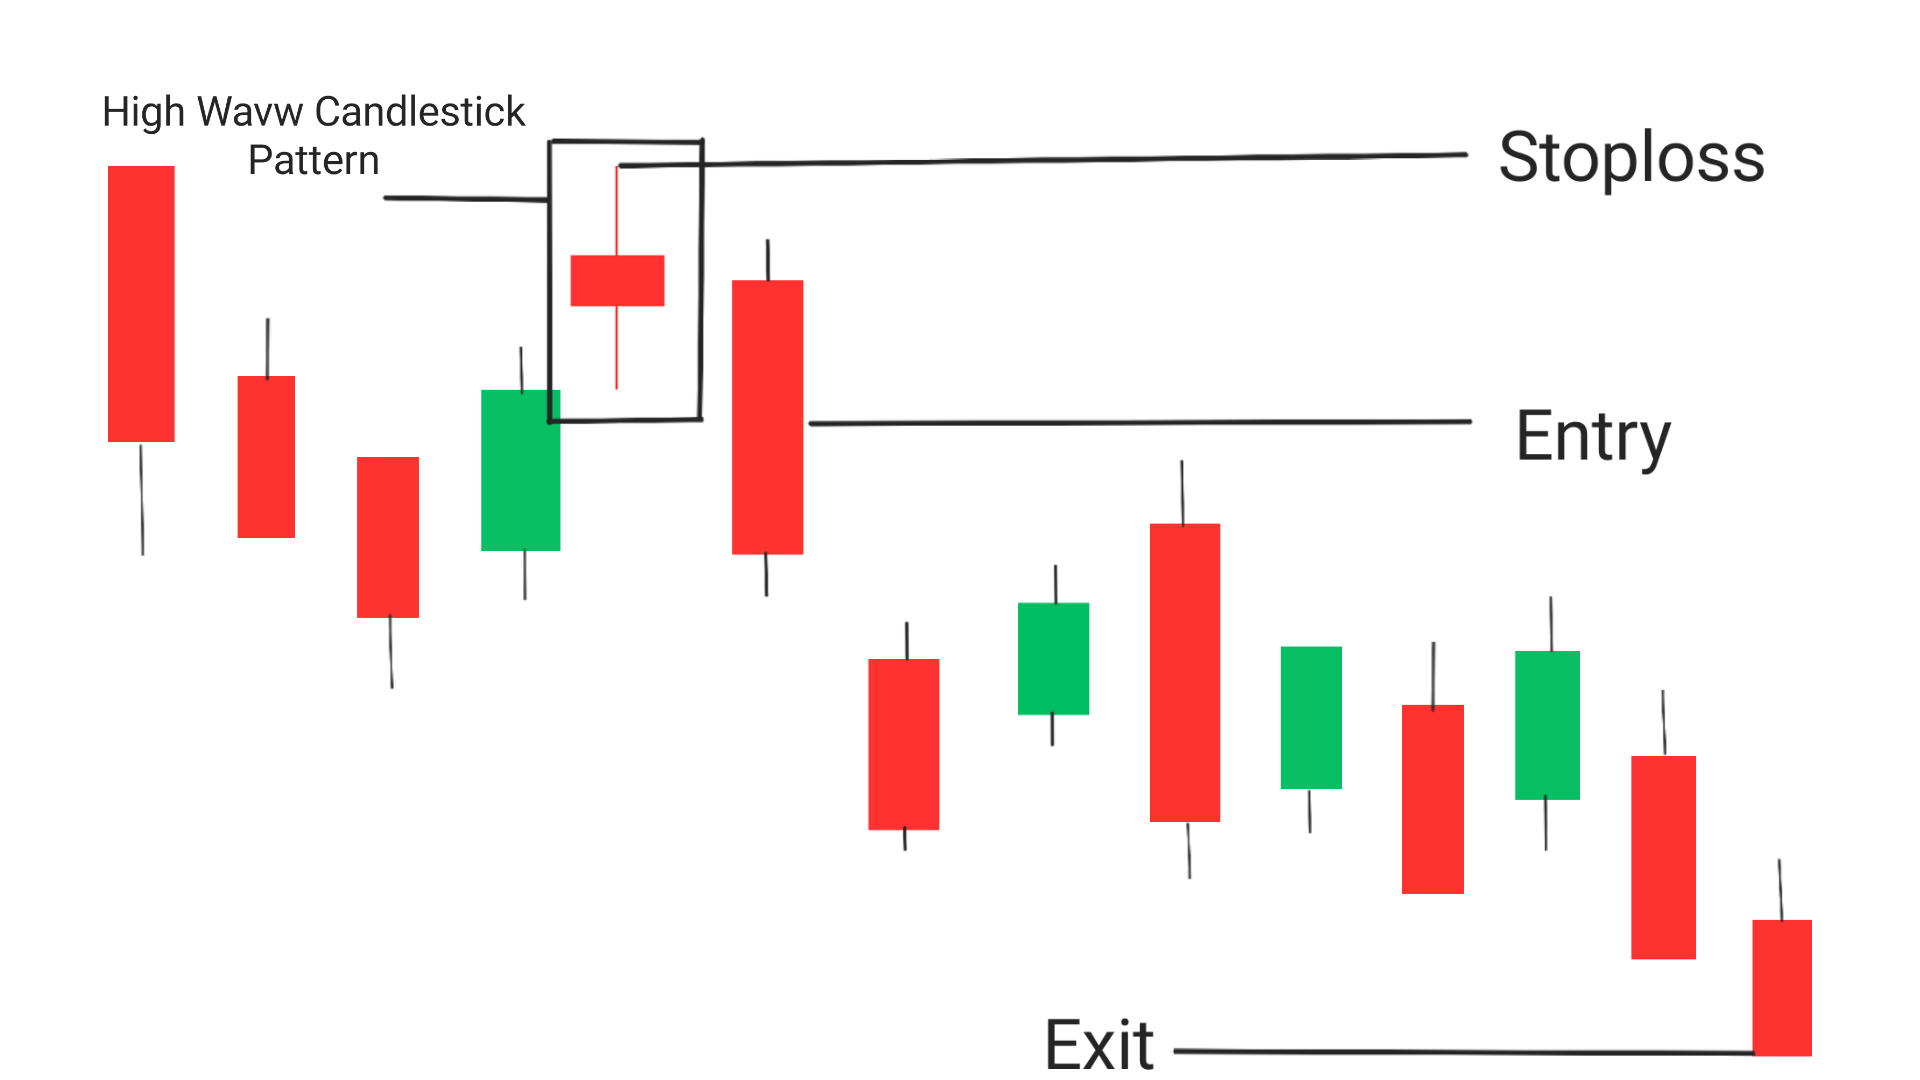
Entry: The best entry point is the from the next candle which breaks the low of the candlestick pattern.
Exit: Exit the trade if you have achieved your goal or if the price has reached a significant support level, If you want to trade more then you can look for a real breakout near support level if it happens then take another trade upto next support level.
Stoploss: In order to minimize the risk of stoploss hitting, Stoploss must be set at the high of high wave pattern.
Following are general procedure for trading while using high wave candlestick pattern
1. Look for the high wave candlestick pattern on your chart. This pattern can appear at the top or bottom of a trend, or in the middle of a range-bound market.
2. Analyze the context of the pattern. Is it occurring after a strong uptrend or downtrend? Is there any significant news or economic data that could impact the market?
3. Determine the direction of the trend. If the high wave candlestick appears at the top of an uptrend, it could signal a potential reversal to a downtrend. If it appears at the bottom of a downtrend, it could signal a potential reversal to an uptrend.
4. Look for confirmation. Before entering a trade based on the high wave candlestick pattern, look for confirmation from other technical indicators or price action signals.
5. Place your trade. If you decide to enter a trade based on the high wave candlestick pattern, place your stop loss below the low of the candlestick and your take profit at a reasonable level based on your risk/reward ratio.
NOTE
1. High wave pattern can be found in all time frames, from intraday to monthly charts.
2. The high wave candlestick can also be referred to as a long-legged doji or a long-legged spinning top.
3. Traders should always consider the context in which the high wave pattern appears before making any trading decisions.
4. The high wave pattern is not always a reliable signal and should be used in combination with other technical indicators for confirmation.
5. Traders must pay attention to the volume during the trading period when a high wave pattern appears, as higher volume can confirm the validity of the signal.
Conclusion
The high wave pattern is a useful tool for traders to identify potential trend reversals or continuations. Its long shadows and small real body indicate indecision in the market, which can lead to a change in direction. However, traders should always look at other technical indicators and price action to confirm their interpretation of the high wave candlestick.
Frequently Asked Questions(FAQs)
1. What is the difference between a high wave candlestick and a doji candlestick?
A high wave candlestick has a small real body and long upper and lower shadows, while a doji candlestick has a small real body and almost no shadows. Both candlesticks indicate indecision in the market, but the high wave candlestick shows more price movement during the trading period.
2. How can I use the high wave candlestick in my trading strategy?
Traders can use the high wave candlestick to identify potential trend reversals or continuations. If it appears after a strong uptrend or downtrend, it could signal a potential reversal. Conversely, if it appears during a consolidation phase, it could indicate a continuation of the current trend.
3. Can the high wave candlestick be used in combination with other technical indicators?
Yes, traders can use the high wave candlestick in combination with other technical indicators such as moving averages, trend lines, and support and resistance levels to confirm their analysis.