Falling Window Candlestick Pattern
The world of trading is full of patterns and indicators that traders use to make decisions. One such pattern is the Falling Window Candlestick Pattern. This pattern is a bearish indicator that signals a potential reversal in the market. In this blog, we will explore what the Falling Window Candlestick Pattern is, how it works, and how traders can use it to their advantage.

What is the Falling Window Candlestick Pattern?
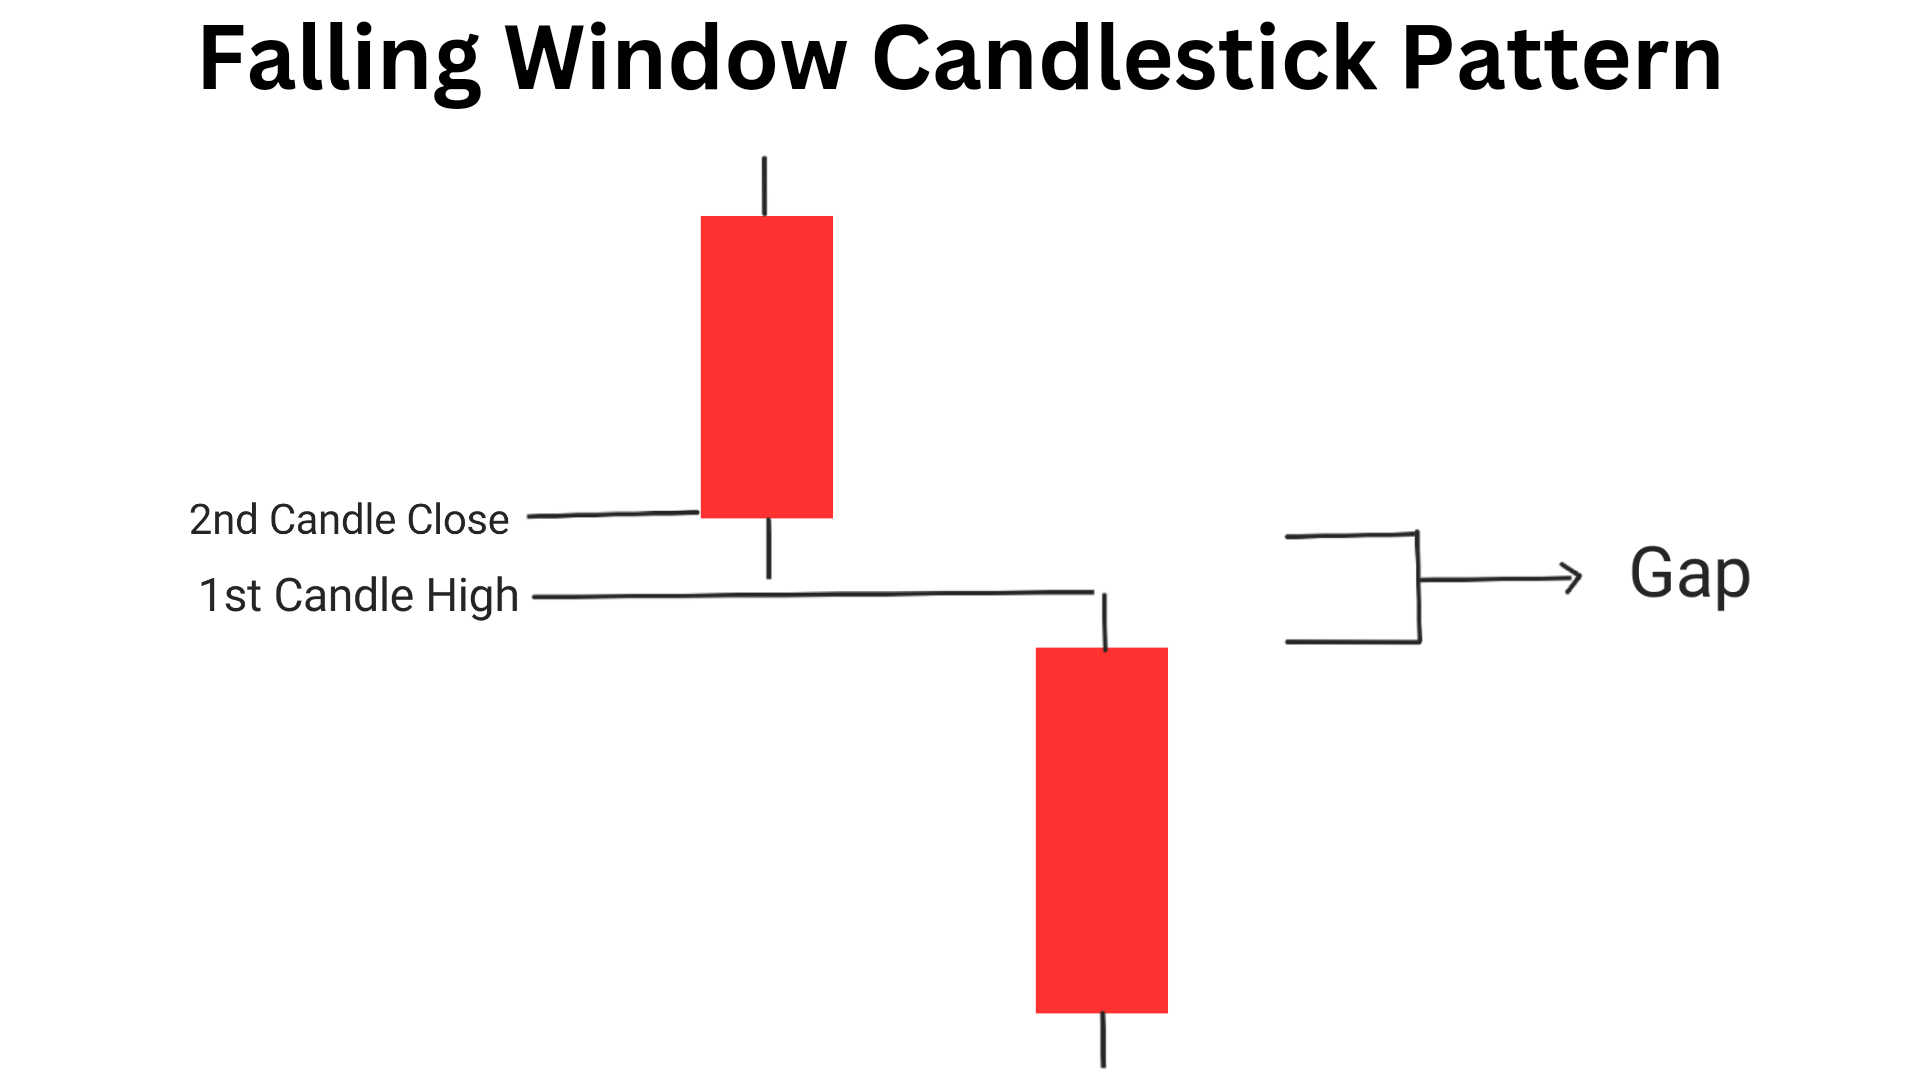
The Falling Window Candlestick Pattern is a two candlestick bearish reversal candlestick pattern that appears on top of an uptrend in a price chart. It is formed when a stock or asset opens lower than the previous day’s low and closes lower than the previous day’s high, creating a gap or window between the two days’ price ranges. It is also known as the Falling Gap candlestick pattern.
following are the features of falling window pattern
1. A long bearish candlestick is followed by a gap down, creating a window between the previous bearish candlestick and the current one.
2. The size of the gap down is significant, indicating a sudden change in market sentiment.
3. The top of the 2nd candles is below the low of the 1st bearish candle.
4. The volume during the formation of the pattern is usually high, indicating strong selling pressure.
5. The falling window pattern is often accompanied by other bearish indicators such as a bearish divergence or a break below a key support level.
The pattern is called “Falling” because the price falls through the window or gap. This pattern is a strong indication that the bears have taken control of the market and that there is a high probability of further downside momentum.
How does the Falling Window Candlestick Pattern work?
The Falling Window Candlestick Pattern works by showing a sudden shift in market sentiment. The pattern indicates that there has been a significant change in the supply and demand of an asset. When the market opens lower than the previous day’s low, it shows that there are more sellers than buyers in the market. This shift in sentiment can be caused by a variety of factors, such as negative news or economic data.
When the price closes lower than the previous day’s high, it confirms that the sellers are in control and that there is a high probability of further downside momentum. The gap or window between the two days’ price ranges acts as a resistance level, which means that it is likely to be difficult for the price to move back up through this level.
Traders can use the Falling Window Candlestick Pattern to identify potential short-selling opportunities. They can enter a short position when the price falls through the window or gap, with a stop loss above the high of the previous day. This strategy allows traders to take advantage of the bearish momentum and profit from the downside move.
In simple words , the Psycology behind falling window pattern is:-
1.Earlier, the movement was in downtrend, which was controlled by sellers. Then a uptrend appears means price started moving upward.
2. In this scenario due to fear of loss sellers sell their short position and some traders see it as a chance to buy shares.
3.It concludes that demand is more and price goes in hand of buyers, but after sometime price reaches a resistance level then first candle of falling window pattern appears which means sellers have started taking control over market.
4. Then second bearish candle of high volume appears with a gap down opening , which encourages bears to short shares and create a fear in mind of bulls and they exit their position.
5. With this high pressure of selling, price starts moving downward and everyone follows the trend.
Top Bestseller mastermind book to learn trading from scratch along with examples click here.
How to identify the Falling Window Candlestick Pattern?
To identify the Falling Window Candlestick Pattern, traders need to look for a candlestick that has a lower opening price than the previous day’s low and a lower closing price than the previous day’s high. The candlestick should have a gap or window between the two days’ price ranges. Look for the following features:-
1. A long bearish candlestick is followed by a gap down, creating a window between the previous bearish candlestick and the new bearish candle.
2. The size of the gap down is significant, indicating a sudden change in market sentiment.
3. The top of the 2nd candles is below the low of the 1st bearish candle.
4. The volume during the formation of the pattern is usually high, indicating strong selling pressure.
5. The falling window pattern is often accompanied by other bearish indicators such as a bearish divergence or a break below a key support level.
The pattern can be confirmed by looking for other bearish indicators, such as a decrease in trading volume or a bearish divergence in the Relative Strength Index (RSI). Traders should also pay attention to any fundamental factors that may be contributing to the shift in market sentiment.
How to trade falling window candlestick pattern?
To trade the Falling Window Candlestick Pattern, traders can follow the steps below:
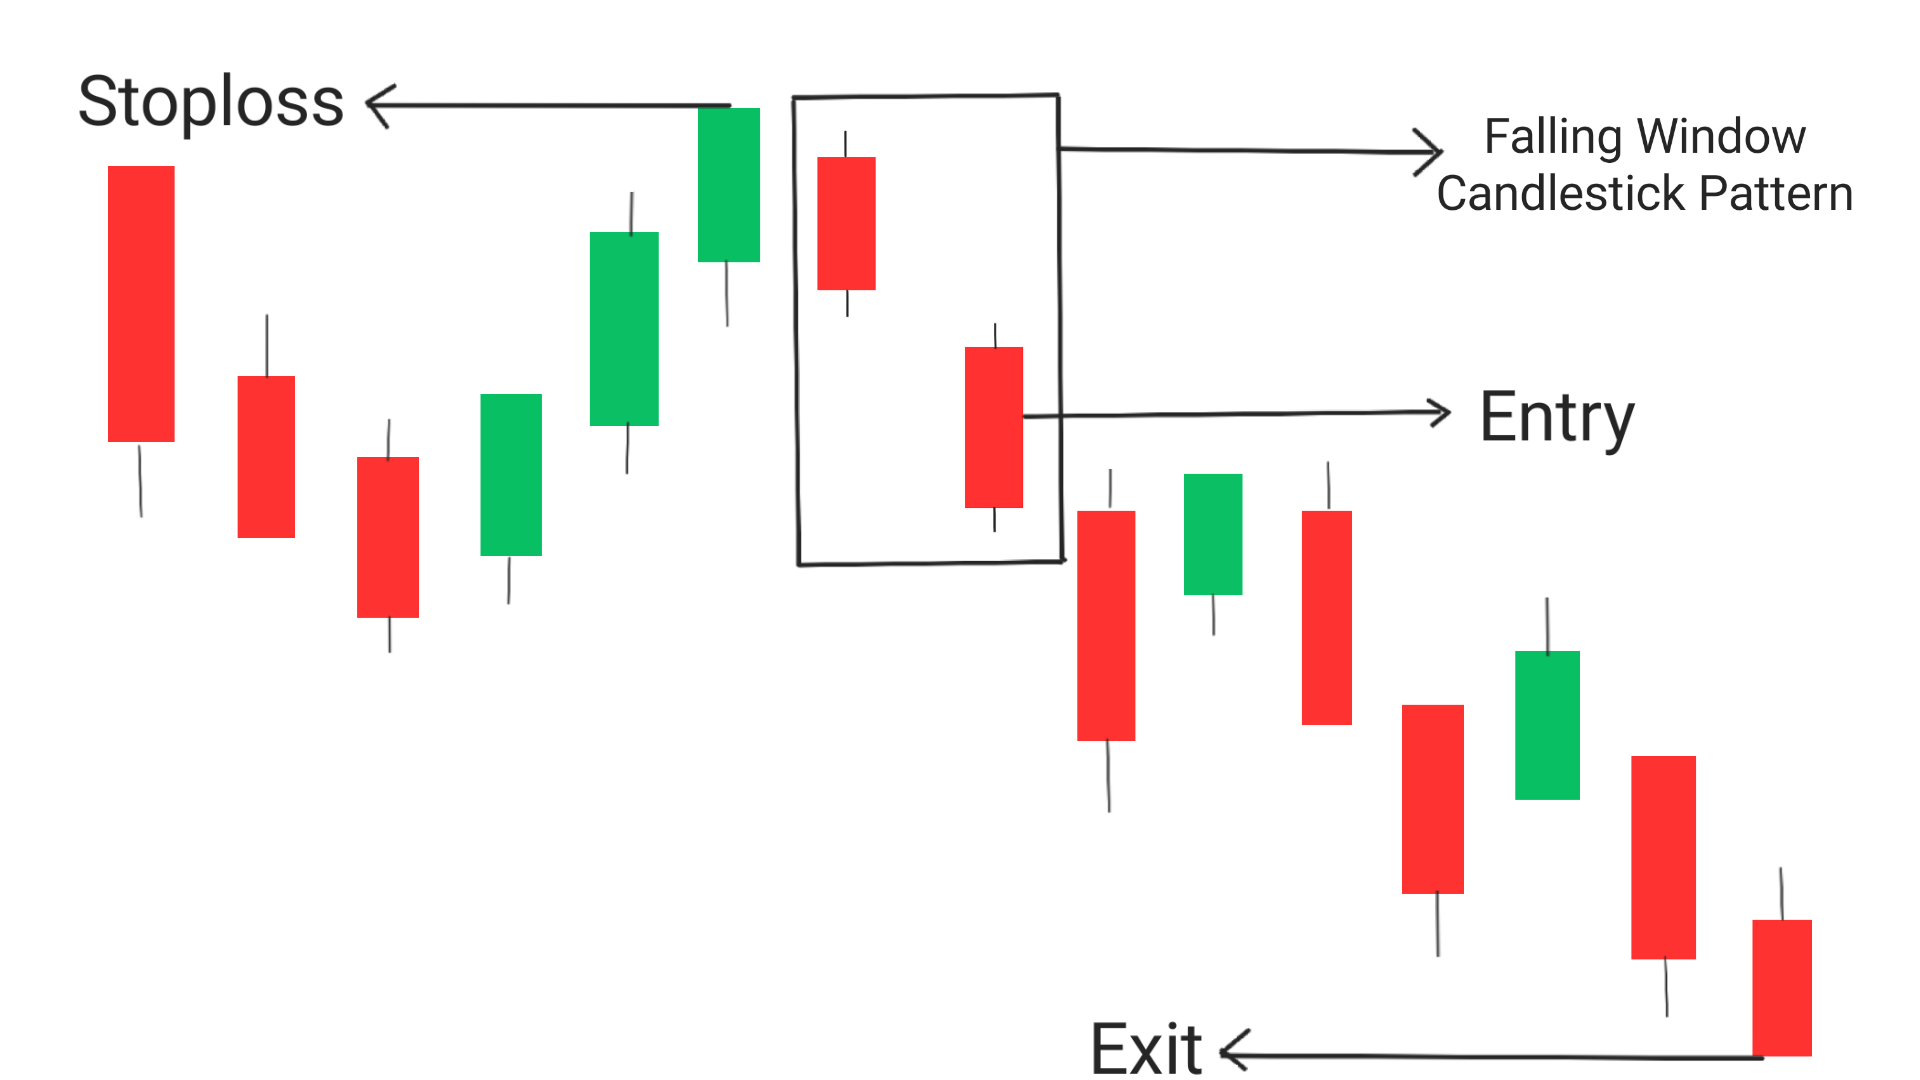
Entry: The best entry point for this pattern is when the chart was earlier in downward movement, but then faces a push and again experiences an downtrend movement from a resistance level. Then rising window pattern forms on the chart. It is considered to be the best entry point from the second candle.
Exit: Exit the trade , when it reaches your pre-determined target or when it reaches a significant support level. If you want to trade more then you can look for a breakout near the support level, if it happens then take trade upto new support level.
Stoploss: In order to minimise the risk of loss, stoploss must be set at the high of the candlestick pattern.
1.Confirmation using volume of 2nd candle: While the falling window candlestick pattern is formed, if the volume of the 2nd candle of the pattern is greater than the first it is considerd to be a strong bearish signal.
2. Entry within the second candle: It is important to note that entry must be taken within the second candle otherwise, there are high probability that price will again move up with gap down opening. If you fail to do so then difference between entry and stoploss will be high and ultimately affect your risk to reward ratio.
Step by step process to take a trade using falling window pattern:
1. Identify the pattern: Look for a candlestick that has a lower opening price than the 1st day’s low and a lower closing price than the previous day’s high, with a gap or window between the two days’ price ranges.
2. Confirm the pattern: Look for other bearish indicators, such as a decrease in trading volume or a bearish divergence in the Relative Strength Index (RSI). Pay attention to any fundamental factors that may be contributing to the shift in market sentiment.
3. Enter a short position: When the price falls through the window or gap, enter a short position with a stop loss above the high of the previous day. This strategy allows traders to take advantage of the bearish momentum and profit from the downside move.
4. Manage the trade: Monitor the trade closely and adjust the stop loss as needed to protect profits and limit losses.
5. Exit the trade: Close the trade when the price reaches a predetermined target or when the market sentiment shifts back in favor of the bulls.
It is important to note that no trading strategy is foolproof, and traders should always use proper risk management techniques and follow their trading plan. By incorporating the Falling Window Candlestick Pattern into their trading strategy, traders can increase their chances of success in the market.
Conclusion
The Falling Window Candlestick Pattern is a powerful bearish indicator that signals a potential reversal in the market. Traders can use this pattern to identify short-selling opportunities and profit from the downside move. To identify the pattern, traders need to look for a candlestick that has a lower opening price than the previous day’s low and a lower closing price than the previous day’s high, with a gap or window between the two days’ price ranges.
Traders should also pay attention to other bearish indicators and fundamental factors that may be contributing to the shift in market sentiment. By understanding how the Falling Window Candlestick Pattern works, traders can improve their trading strategies and make more informed decisions.
Frequently Asked Questions(FAQs)
1.What is falling window candlestick?
Falling window candlestick is a 2 candlestick bearish reversal pattern that indicates a potential trend reversal from an uptrend to a downtrend.
2.What is the falling candle pattern?
The falling candle pattern is a bearish candlestick pattern where a long bearish candlestick is followed by a gap down, creating a window between the previous candlestick and the current one.
3.What is the window in the candlestick pattern?
The window in the candlestick pattern refers to the gap down between the previous candlestick and the current one.
4.Which candle is most powerful?
The most powerful candle in the falling window pattern is the following bearish candle that closes below the low of the previous c
andlestick, confirming the trend reversal.5.What is the most bullish candlestick?
The most bullish candlestick is the hammer candlestick, which has a small body and a long lower shadow, indicating strong buying pressure and a potential trend reversal from a downtrend to an uptrend.