Mastering the Expanding Triangle Pattern with 5 FAQs
Are you tired of missing out on potential trend reversals in the financial markets? Look no further than the expanding triangle pattern! This popular technical analysis tool can help traders identify when an asset’s price is creating higher highs and lower lows, indicating a potential trend reversal.
By understanding how to identify and use the expanding triangle pattern, traders can make informed trading decisions and achieve their financial goals. So, let’s dive into the world of technical analysis and explore the power of the expanding triangle pattern.

How Traders Can Use the Expanding Triangle Pattern to Identify Potential Trend Reversals
What is Expanding Triangle Pattern?
The expanding triangle pattern is a popular technical analysis tool used by traders from decades to identify potential trend reversals in the financial markets. This pattern is formed when the price of an asset creates higher highs and lower lows, creating a triangle shape that expands over time.
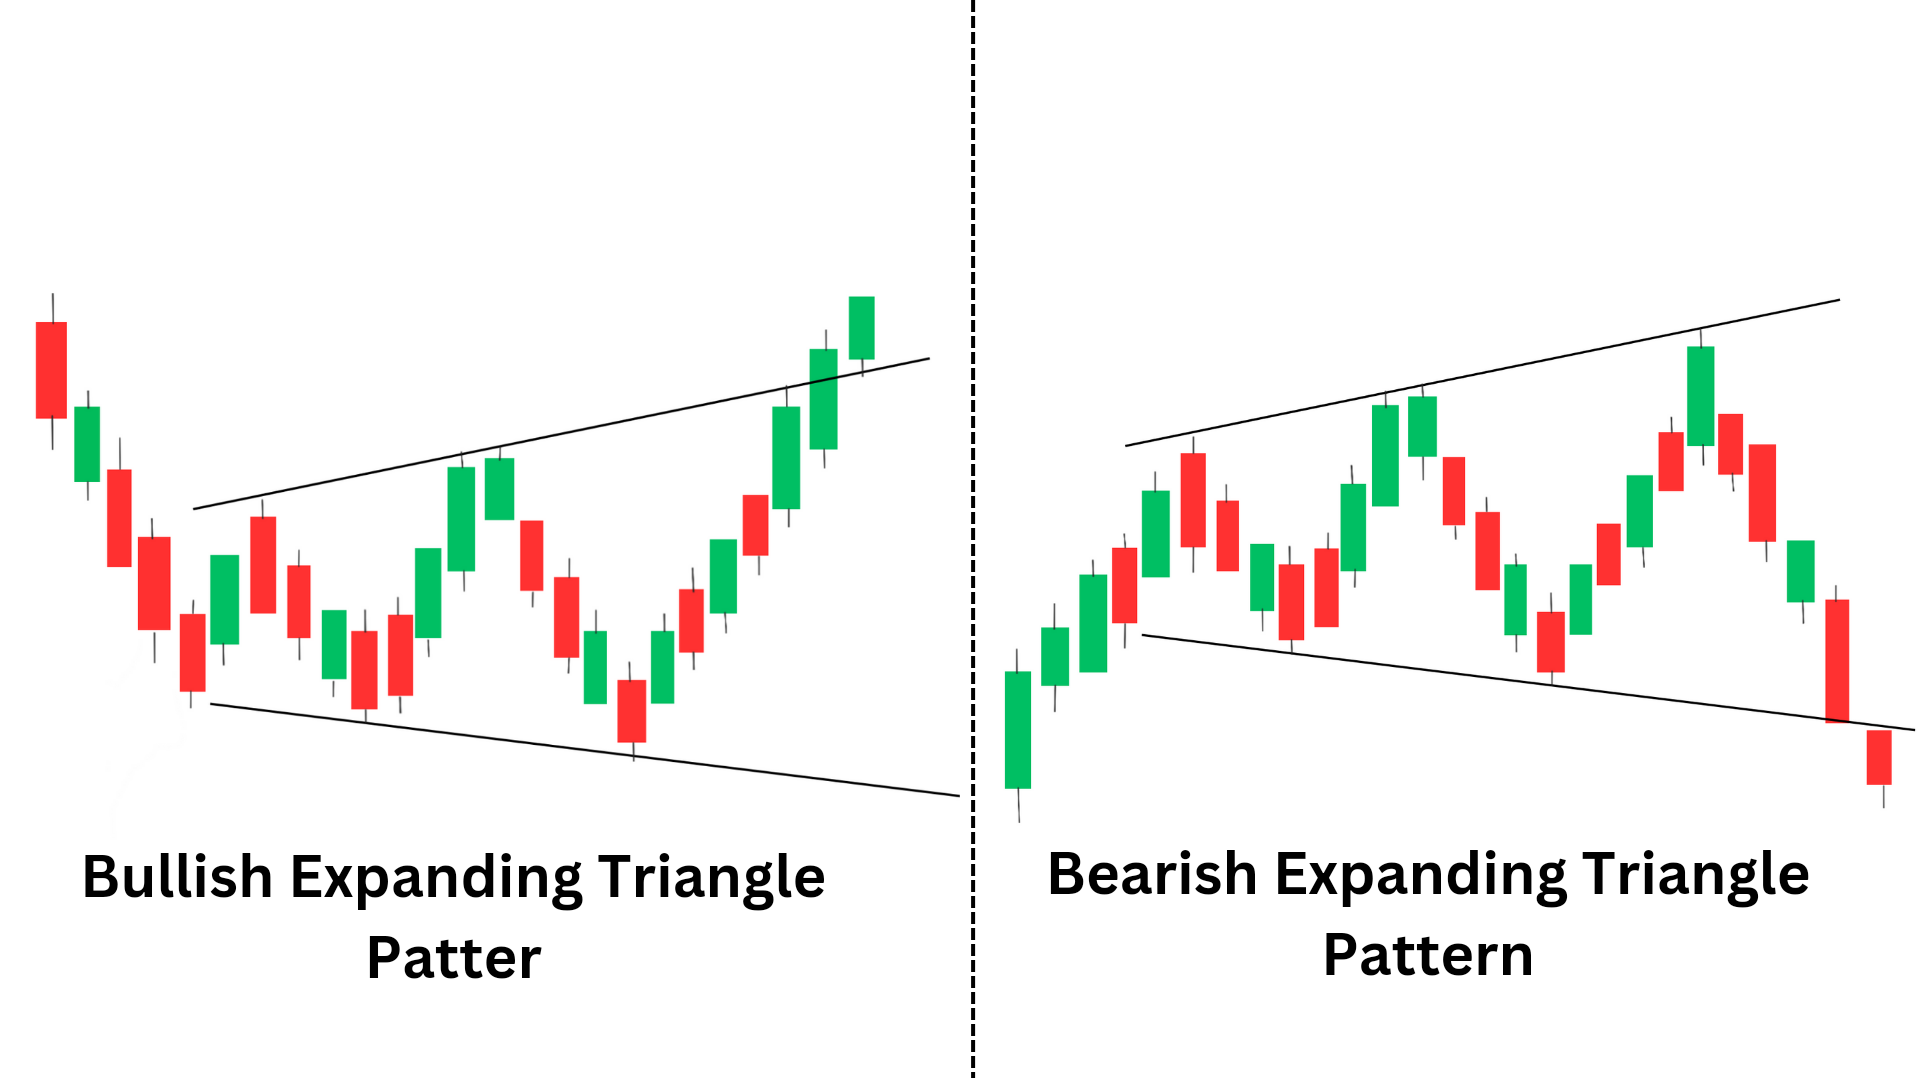
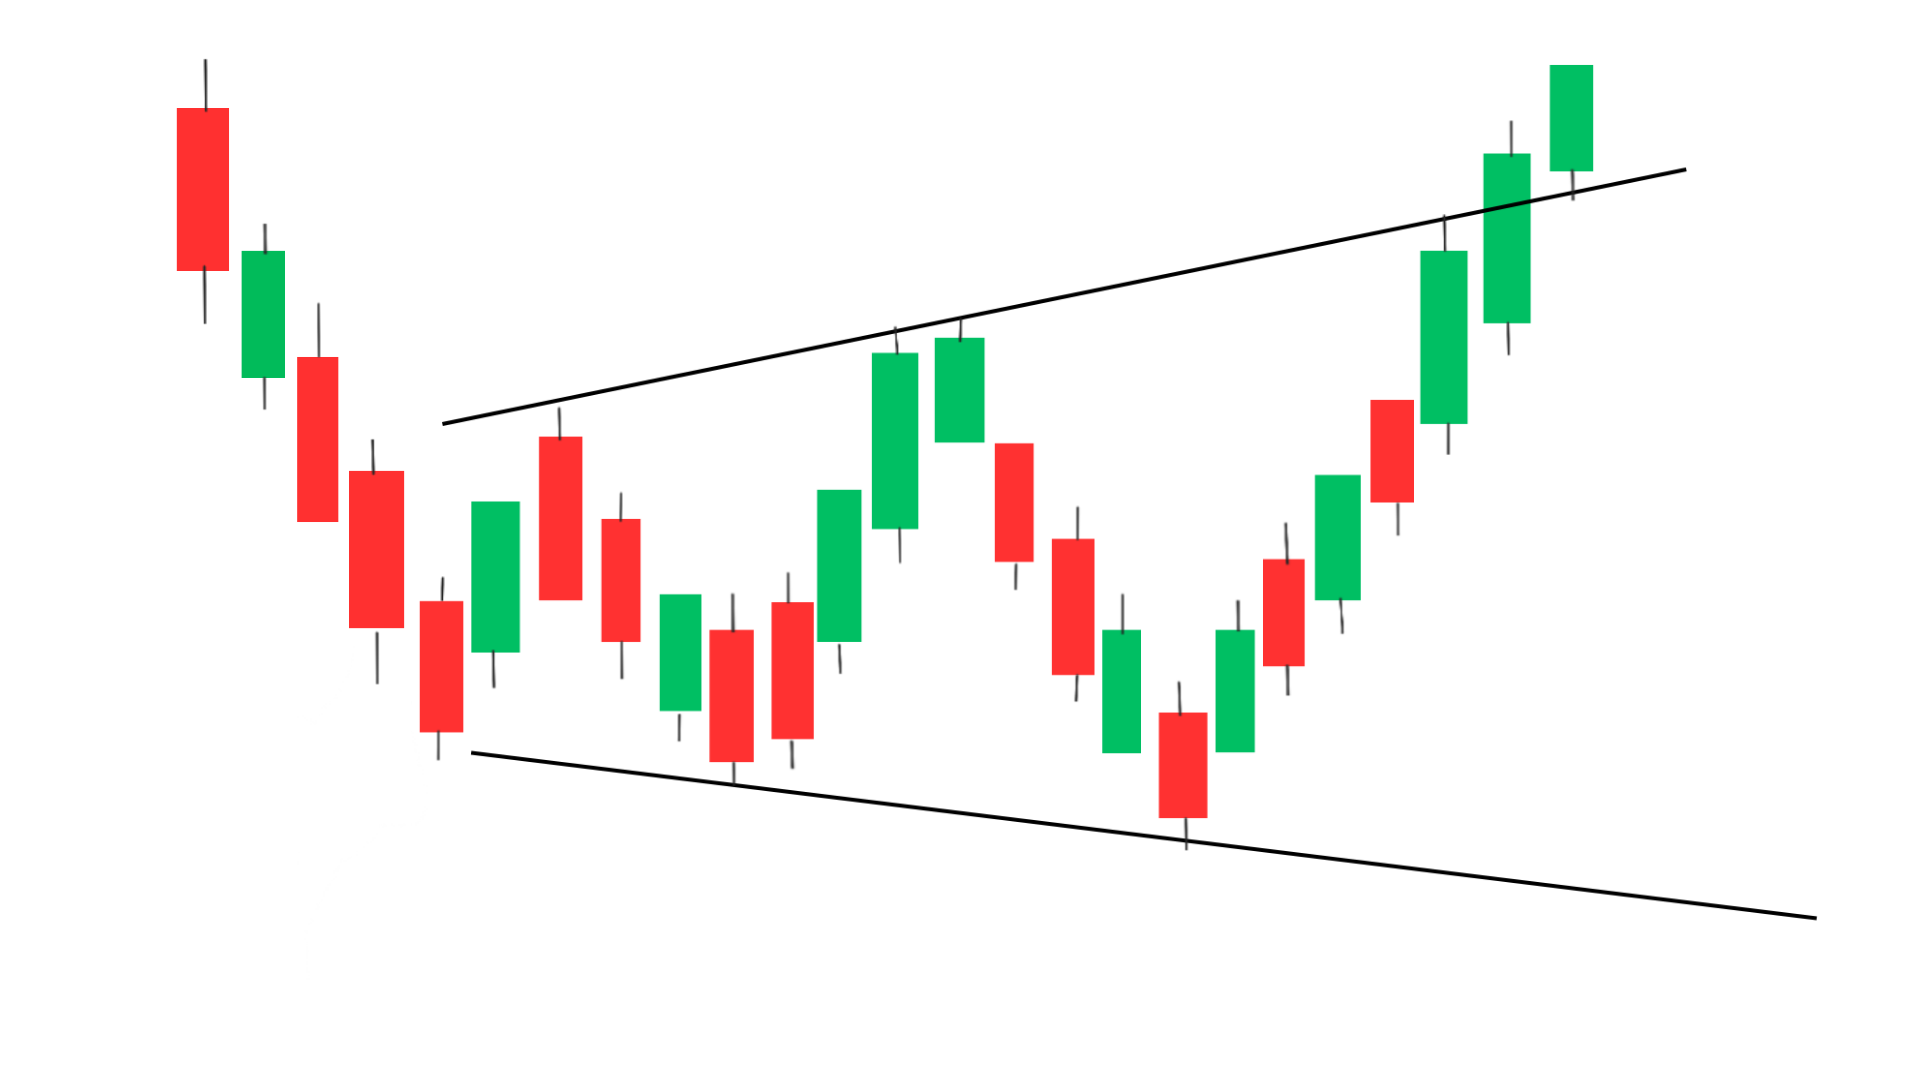
Bullish Expanding Triangle Pattern
Bullish expanding tiangle pattern is a bullish reversal chart pattern, It consists of higher highs and lower lows, indicating that buyers are becoming more aggressive while sellers are losing momentum.
This creates a widening range between the trendlines of the pattern. When the price breaks out above the upper trendline with high trading volume, it is considered a bullish signal, indicating that buyers have taken control of the market and that the price is likely to continue rising.
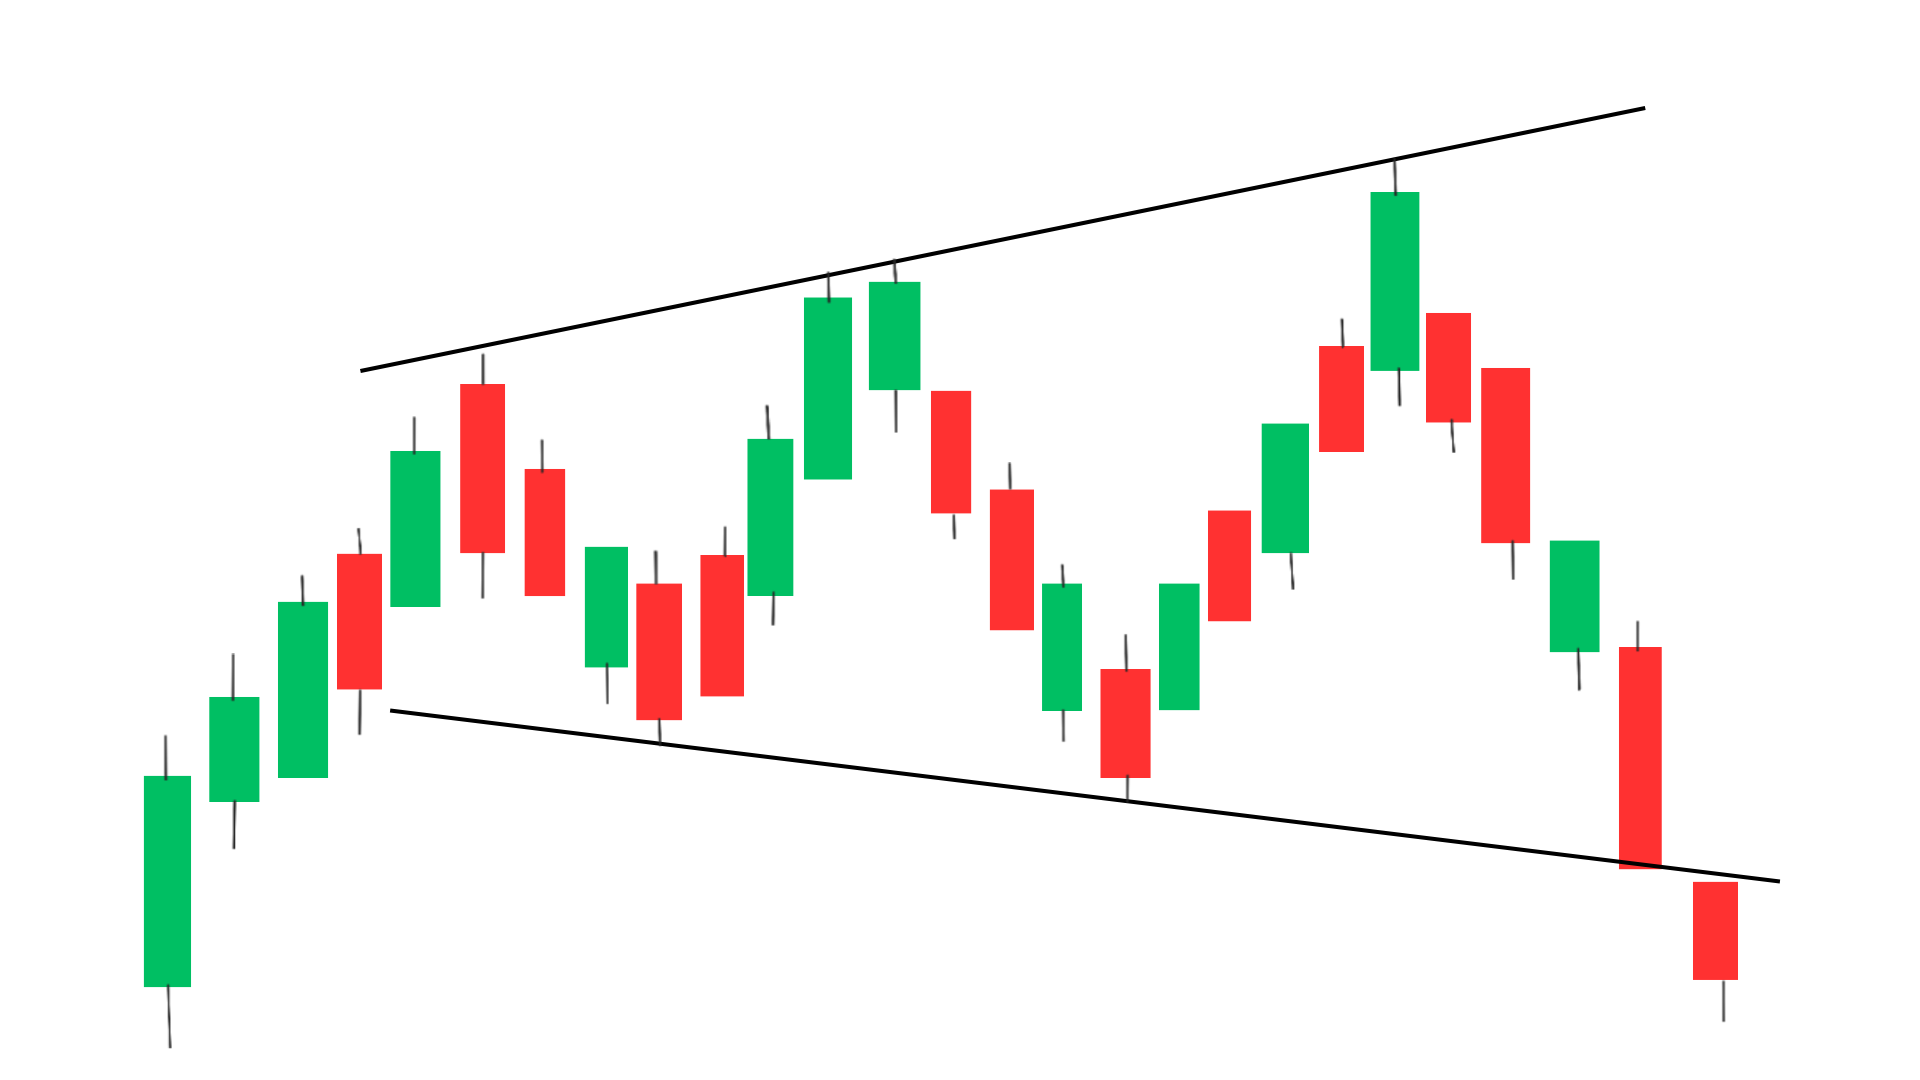
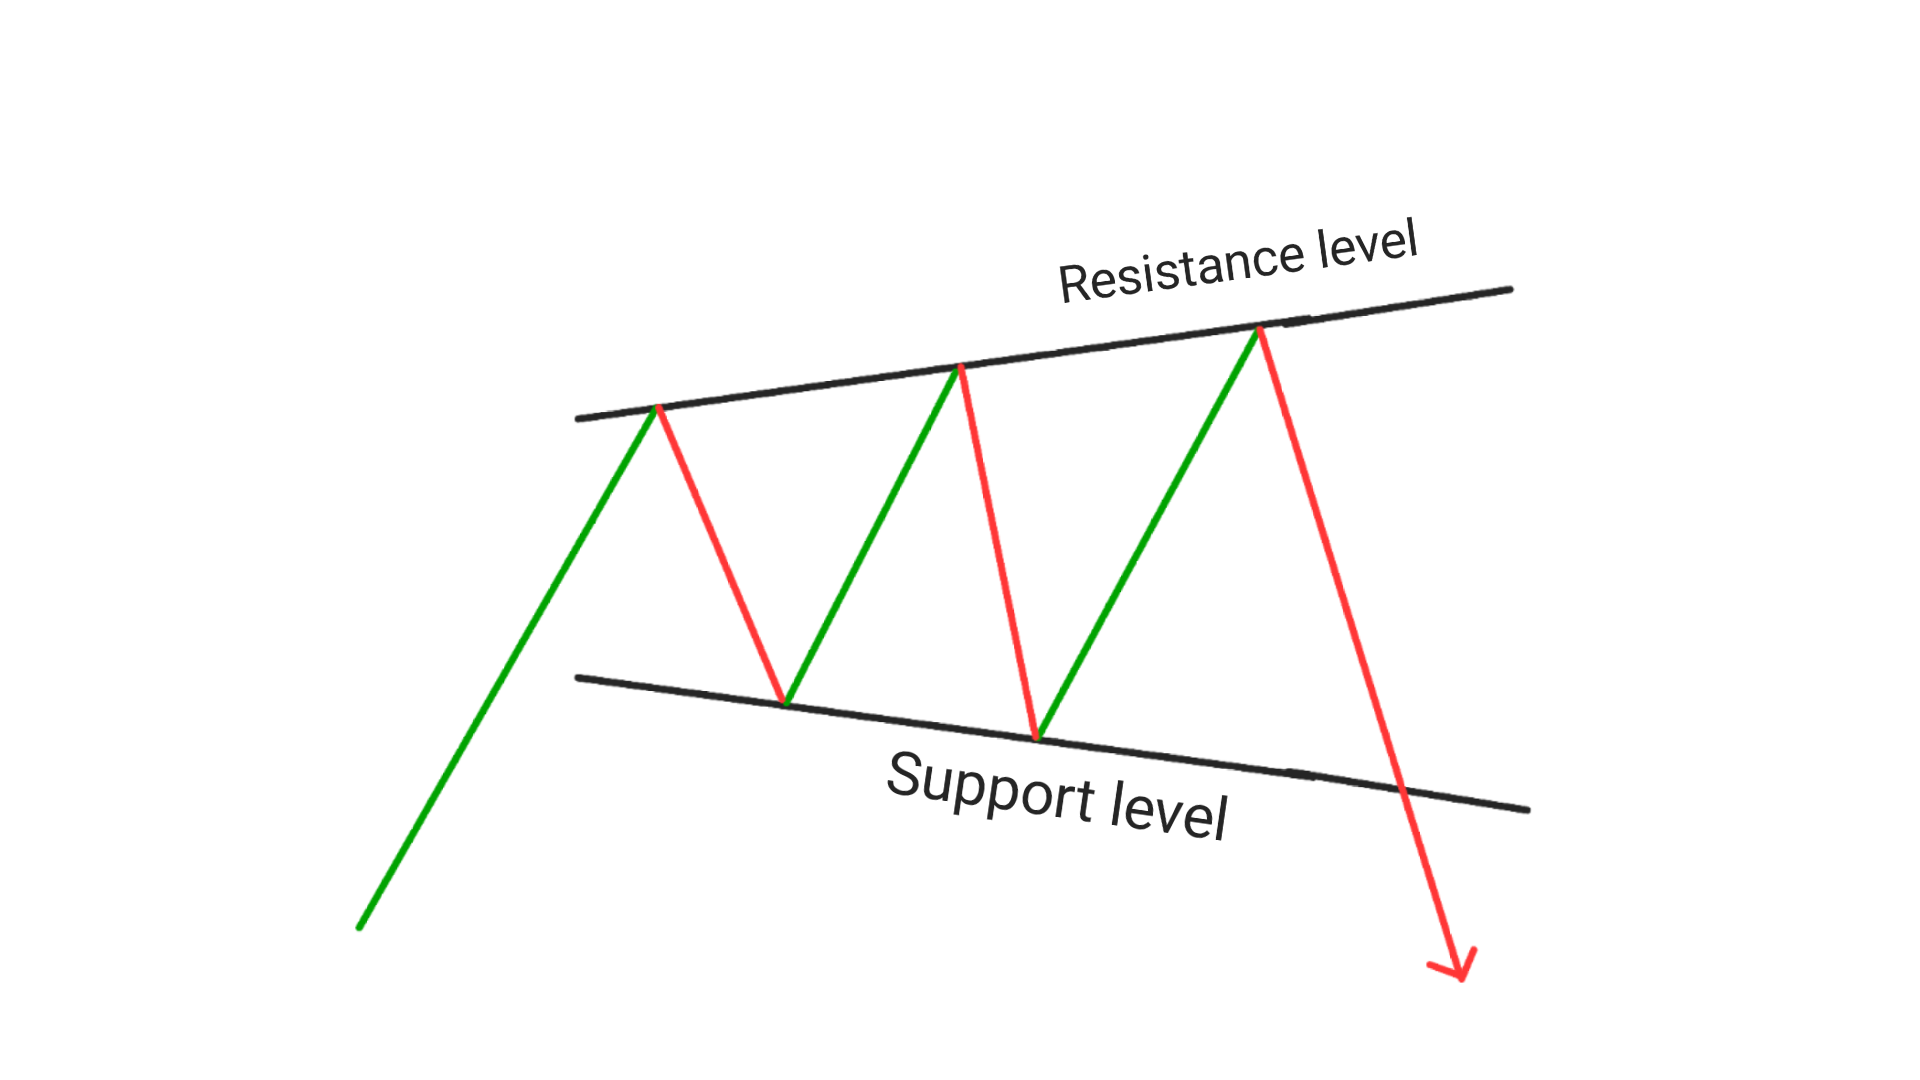
Bearish Expanding Triangle Pattern
Bearish expanding triangle pattern is a bearish reversal chart pattern, the price forms lower lows and higher highs, indicating that sellers are becoming more aggressive while buyers are losing momentum.
This creates a widening range between the trendlines of the pattern. When the price breaks out below the lower trendline with high trading volume, it is considered a bearish signal, indicating that sellers have taken control of the market and that the price is likely to continue falling.
How to Identify the Expanding Triangle Pattern
To identify an expanding triangle pattern, follow these steps:
1. Look for a trend of higher highs and lower lows or lower highs and higher lows.
2. Draw two trendlines connecting the highs and lows of the price action. These trendlines should be converging, with one sloping upwards and the other sloping downwards.
3. As the price moves towards the apex of the triangle, it should touch each trendline at least twice.
4. Look for a breakout in either direction as the price moves past the apex of the triangle. A breakout above the upper trendline is a bullish signal, while a breakout below the lower trendline is a bearish signal.
It’s important to note that not all triangles are expanding triangles. Symmetrical triangles, ascending triangles, and descending triangles are other types of triangle patterns that can appear on a price chart.
Using the Expanding Triangle Pattern for Trading Decisions
Traders use the expanding triangle pattern to enter or exit trades, as it can indicate a potential trend reversal. When the price breaks out of the triangle pattern, it can signal a bullish or bearish trend, depending on whether it breaks above the upper trend line or below the lower trend line.
It’s important to note that the expanding triangle pattern is not always reliable and should be used in conjunction with other technical analysis tools. Traders should also consider other factors such as market trends, economic indicators, and news events that may impact the price of the asset.
Formation of Expanding Triangle Pattern
Here are the key points to understand the formation of an expanding triangle pattern:
1. The pattern is formed by a series of higher highs and lower lows, creating two trend lines that diverge from each other.
2. The pattern typically forms during periods of high volatility and uncertainty in the market.
3. Traders can identify the pattern by looking for at least five touchpoints on each trend line, forming a clear pattern of higher highs and lower lows.
4. The price swings become more extreme as the pattern develops, creating a wider and wider price range over time.
5. Once the pattern is identified, traders can use it to make informed trading decisions, such as entering or exiting positions or setting stop-loss orders.
How To Trade Expanding Triangle Pattern?
The expanding triangle pattern is a technical analysis pattern that indicates a period of increased volatility and uncertainty in the market. To trade this pattern, follow these steps:
Bullish Expanding Triangle Pattern
1. Identify the pattern: Look for a series of higher highs and lower lows on the price chart. The pattern will resemble a triangle with both sides sloping in opposite directions.
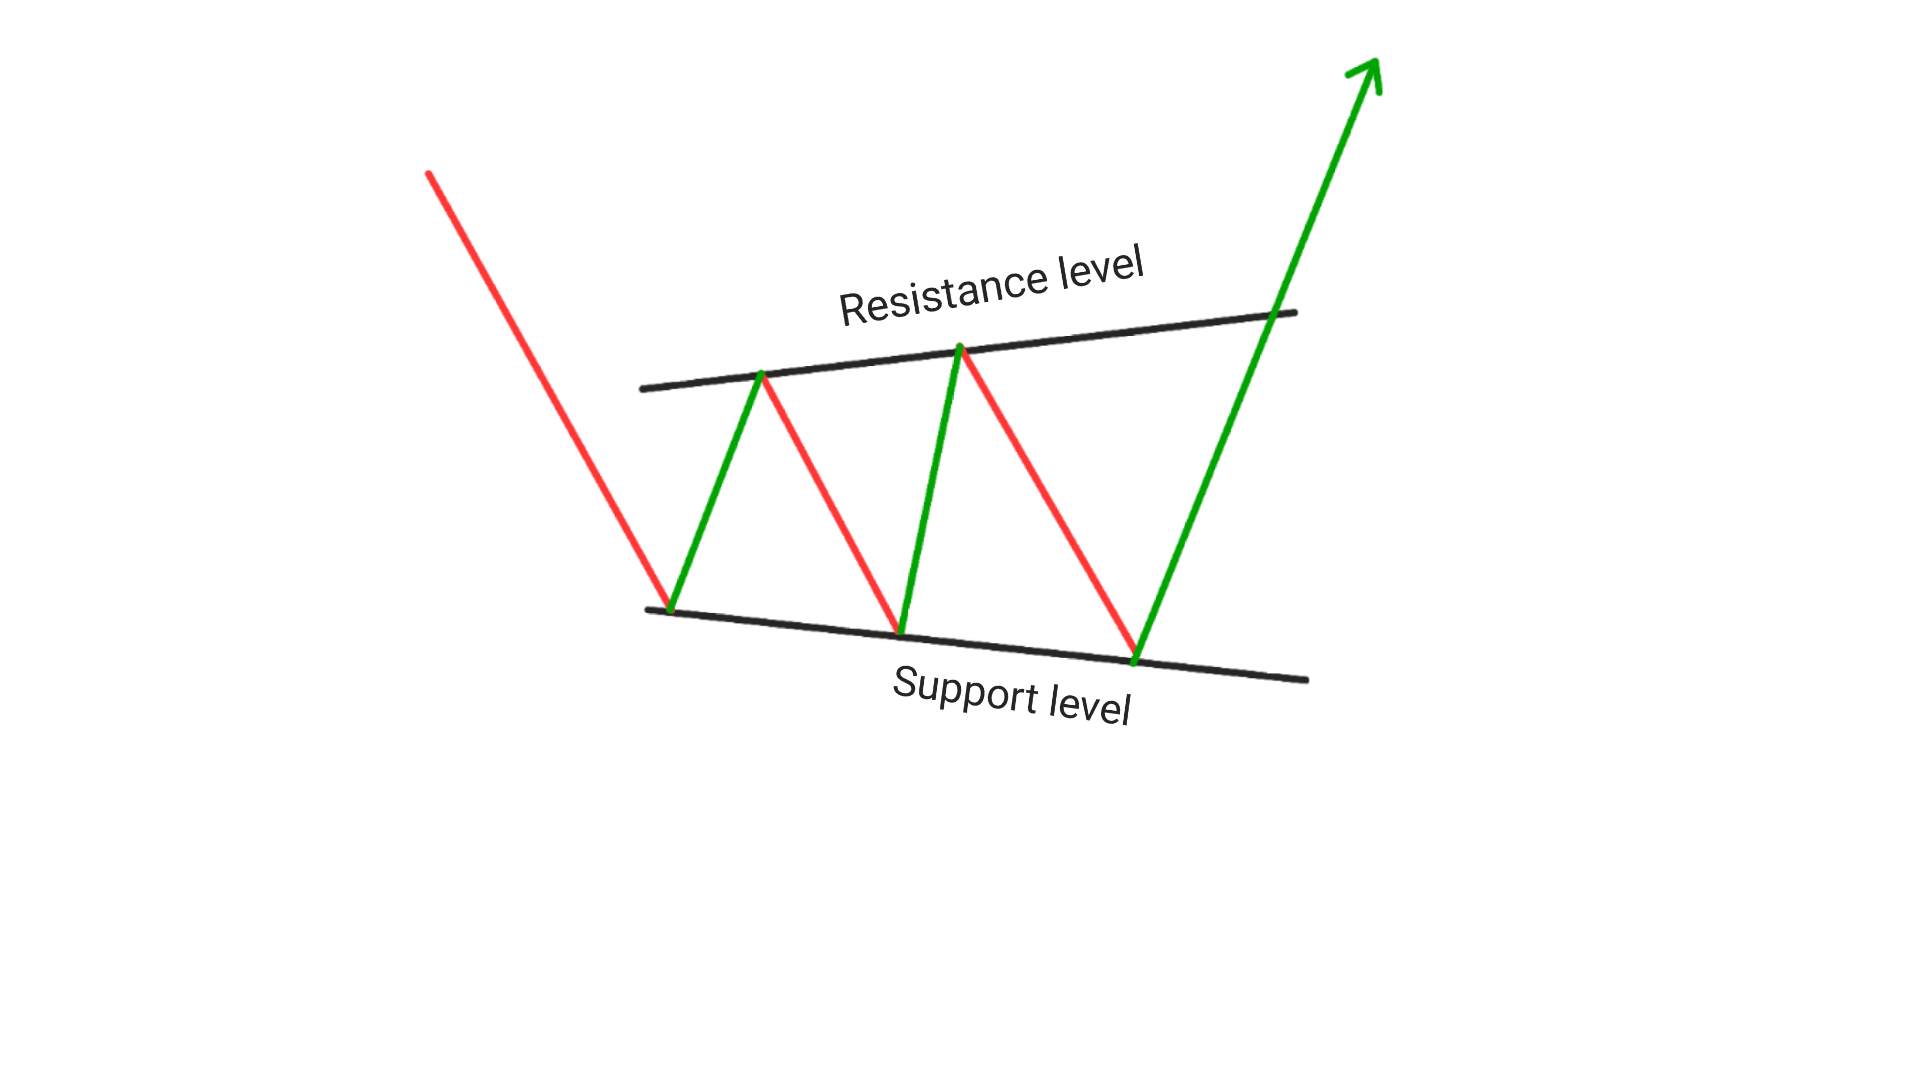
2. Determine the direction of the trend: Bullish expanding triangles occur in uptrend. Determine the direction of the trend to help you decide which way to trade.
3. Entry : As soon as the bullish expanding triangle pattern gives breakout at the resistance level, Enter a long(buy) position from the next candle next to the candle which gave breakout.
4. Set your stop loss: Place your stop loss at the low the candle previous to the candle which gave breakout.
5. Take profits: Take profits at predetermined levels based on your trading plan, or use a trailing stop to lock in profits as the price continues to move in your favor.
6. Manage your risk: As with any trading strategy, it is important to manage your risk by using proper position strategies, THere are always chances of failure so trade according to price action.
Bearish Expanding Triangle Pattern
1. Identify the pattern: Look for a series of higher highs and lower lows on the price chart. The pattern will resemble a triangle with both sides sloping in opposite directions.
2. Determine the direction of the trend: Bearish expanding triangles occur in downtrend. Determine the direction of the trend to help you decide which way to trade.
3. Entry : As soon as the bearish expanding triangle pattern gives breakout at the support level, Enter a short(sell) position from the next candle next to the candle which gave breakout.
4. Set your stop loss: Place your stop loss above the highest high at the candle previous to the candle which gave breakout.
5. Take profits: Take profits at predetermined levels based on your trading plan, or use a trailing stop to lock in profits as the price continues to move in your favor.
6. Manage your risk: As with any trading strategy, it is important to manage your risk by using proper position strategies, THere are always chances of failure so trade according to price action
Conclusion
The expanding triangle pattern is a useful tool for traders looking to identify potential trend reversals in the financial markets. Traders should use this pattern in conjunction with other technical analysis tools and consider other factors that may impact the price of the asset. Entering long or short position with a proper stoploss and exiting the trade at a predetermined target or when the price reaches a significant resistance level.
With careful analysis and a disciplined approach, traders can use the expanding triangle pattern to make informed trading decisions and achieve their financial goals.
Descending and expanding triangle pattern and Ascending and expanding triangle pattern
The descending triangle pattern is a bearish pattern that forms when the price of an asset is making lower highs but remains supported at a horizontal level, creating a series of lower highs and equal lows. The expanding triangle pattern, on the other hand, is a bullish pattern that forms when the price of an asset is making higher highs but remains resisted at a horizontal level, creating a series of higher highs and lower lows.
Symmetrical expanding triangle pattern
A symmetrical expanding triangle pattern is a technical analysis pattern that occurs when the price of an asset is making higher highs and lower lows, forming two converging trendlines. This pattern indicates indecision in the market as buyers and sellers struggle to gain control. As the trendlines converge, the price eventually breaks out in either direction, signaling a potential trend reversal. This pattern can be found in both bullish and bearish markets.
Expanding triangle pattern target: The target for EXPANDING or BROADENING TRIANGLE PATTERN is set to be set on the basis of a predetermined target or wwhen the price reaches a significant price level.
Frequently Asked Questions(FAQs)
1.How do you trade expanding triangles
Trading Expanding Triangles: One way to trade expanding triangles is to wait for a breakout above or below the pattern’s trendlines.
Traders can enter a long position if the price breaks above the upper trendline and a short position if it breaks below the lower trendline. It is important to wait for confirmation of the breakout with high trading volume and to set stop-loss orders to manage risk.
2.Is a broadening triangle pattern bullish or bearish?
Yes,The broadening triangle pattern is a volatile pattern that can be both bullish and bearish, depending on the context in which it appears. If the pattern appears in an uptrend, it is considered bullish, while if it appears in a downtrend, it is considered bearish.
3.What is the increasing triangle pattern in trading?
There is no specific pattern called the “increasing triangle pattern” in trading. However, an ascending triangle pattern is a bullish continuation pattern that forms when the price consolidates between a horizontal resistance level and a rising trendline. It is considered a bullish signal when the price breaks above the resistance level with high trading volume.
4.Ascending Triangle Pattern
An ascending triangle pattern is a bullish continuation pattern that forms when the price consolidates between a horizontal resistance level and a rising trendline. It is considered a bullish signal when the price breaks above the resistance level with high trading volume.
5.Is expanding triangle bullish?
The expanding triangle pattern can be both bullish and bearish, depending on the context in which it appears. If the pattern appears in an uptrend, it is considered bullish, while if it appears in a downtrend, it is considered bearish. However, it is important to wait for confirmation of the breakout with high trading volume before making any trading decisions.