Downside Tasuki Gap: 5 FAQs
Technical analysis is an important tool for traders to understand the market and make informed decisions. One of the most popular technical analysis tools is candlestick patterns, which provides traders with a visual representation of price movements. Among the various candlestick patterns, the downside Tasuki gap is a pattern that can provide trader with valuable information regarding market movements, trends and potential trading opportunities. In this blog, we will discuss the downside Tasuki gap in detail, including what it is, how it works, and how traders can use it for their advantage.
What is the downside Tasuki gap?
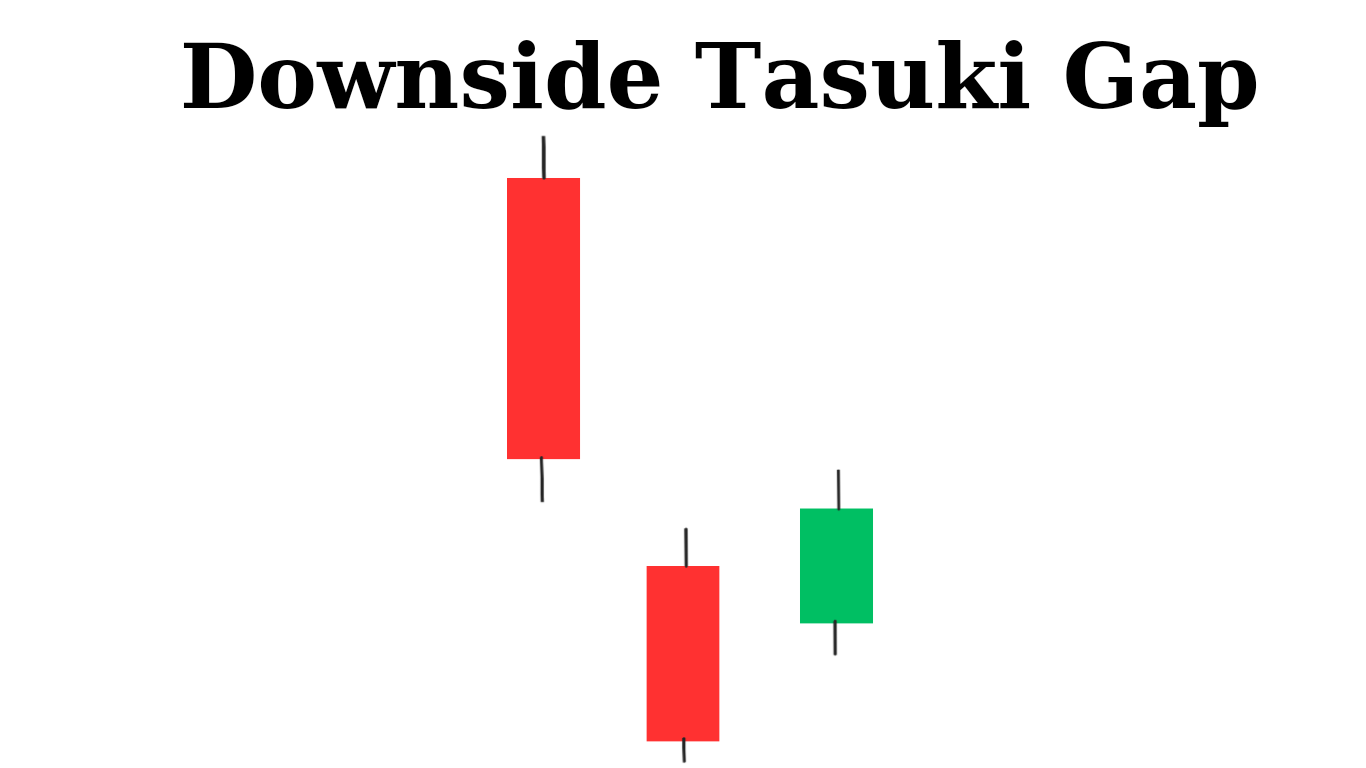
The downside Tasuki gap is a three candlestick bearish continuation pattern that occurs during a downtrend. It consists of three candlesticks, with the first being a bearish(red or black) candlestick, followed by another bearish candlestick that forms with gaps down opening, and finally a bullish(green or ehite) candlestick that opens within the body of the second bearish candlestick. The pattern indicates that the bears are taking control of the market and that there may be further downside movement.
How does the downside Tasuki gap Candlestick Pattern work?
The downside Tasuki gap pattern works by indicating a shift in market sentiment from bullish to bearish. The first bearish candlestick represents selling pressure, but this is quickly followed by another bearish candlestick that gaps down on the open. This indicates that selling pressure has taken over and that the bears are in control. The third bullish candlestick that opens within the body of the second bearish candlestick represents a failed attempt by the bulls to regain control of the market.
The pattern is named after the traditional Japanese garment called Tasuki, which is worn across the chest and tied at the back. The pattern resembles this garment, with the second bearish candlestick acting as a gap between the two bullish candlesticks, much like the gap between the two sides of a Tasuki.
Top Bestseller mastermind book to learn trading from scratch along with examples click here.
How to identify a downside Tasuki gap?
To identify a downside Tasuki gap, traders should look for the following characteristics:
1. Downtrend: The pattern should occur during a downtrend, indicating that the bears are in control of the market.
2. Bearish candlestick: The pattern starts with a bullish candlestick, indicating buying pressure.
3. Bearish gap: The second candlestick is a bearish candlestick that gaps down on the open, indicating that selling pressure has taken over.
4. Bullish candlestick: The third candlestick is another bullish candlestick that opens within the body of the second bearish candlestick, indicating a failed attempt by the bulls to regain control of the market.
5. Confirmation: Traders should wait for confirmation that the pattern is valid before entering a trade. This can be done by waiting for the next candlestick to close below the low of the bullish candlestick that formed the gap.
How to trade a downside Tasuki gap?
To trade a downside Tasuki gap, traders can follow these steps:

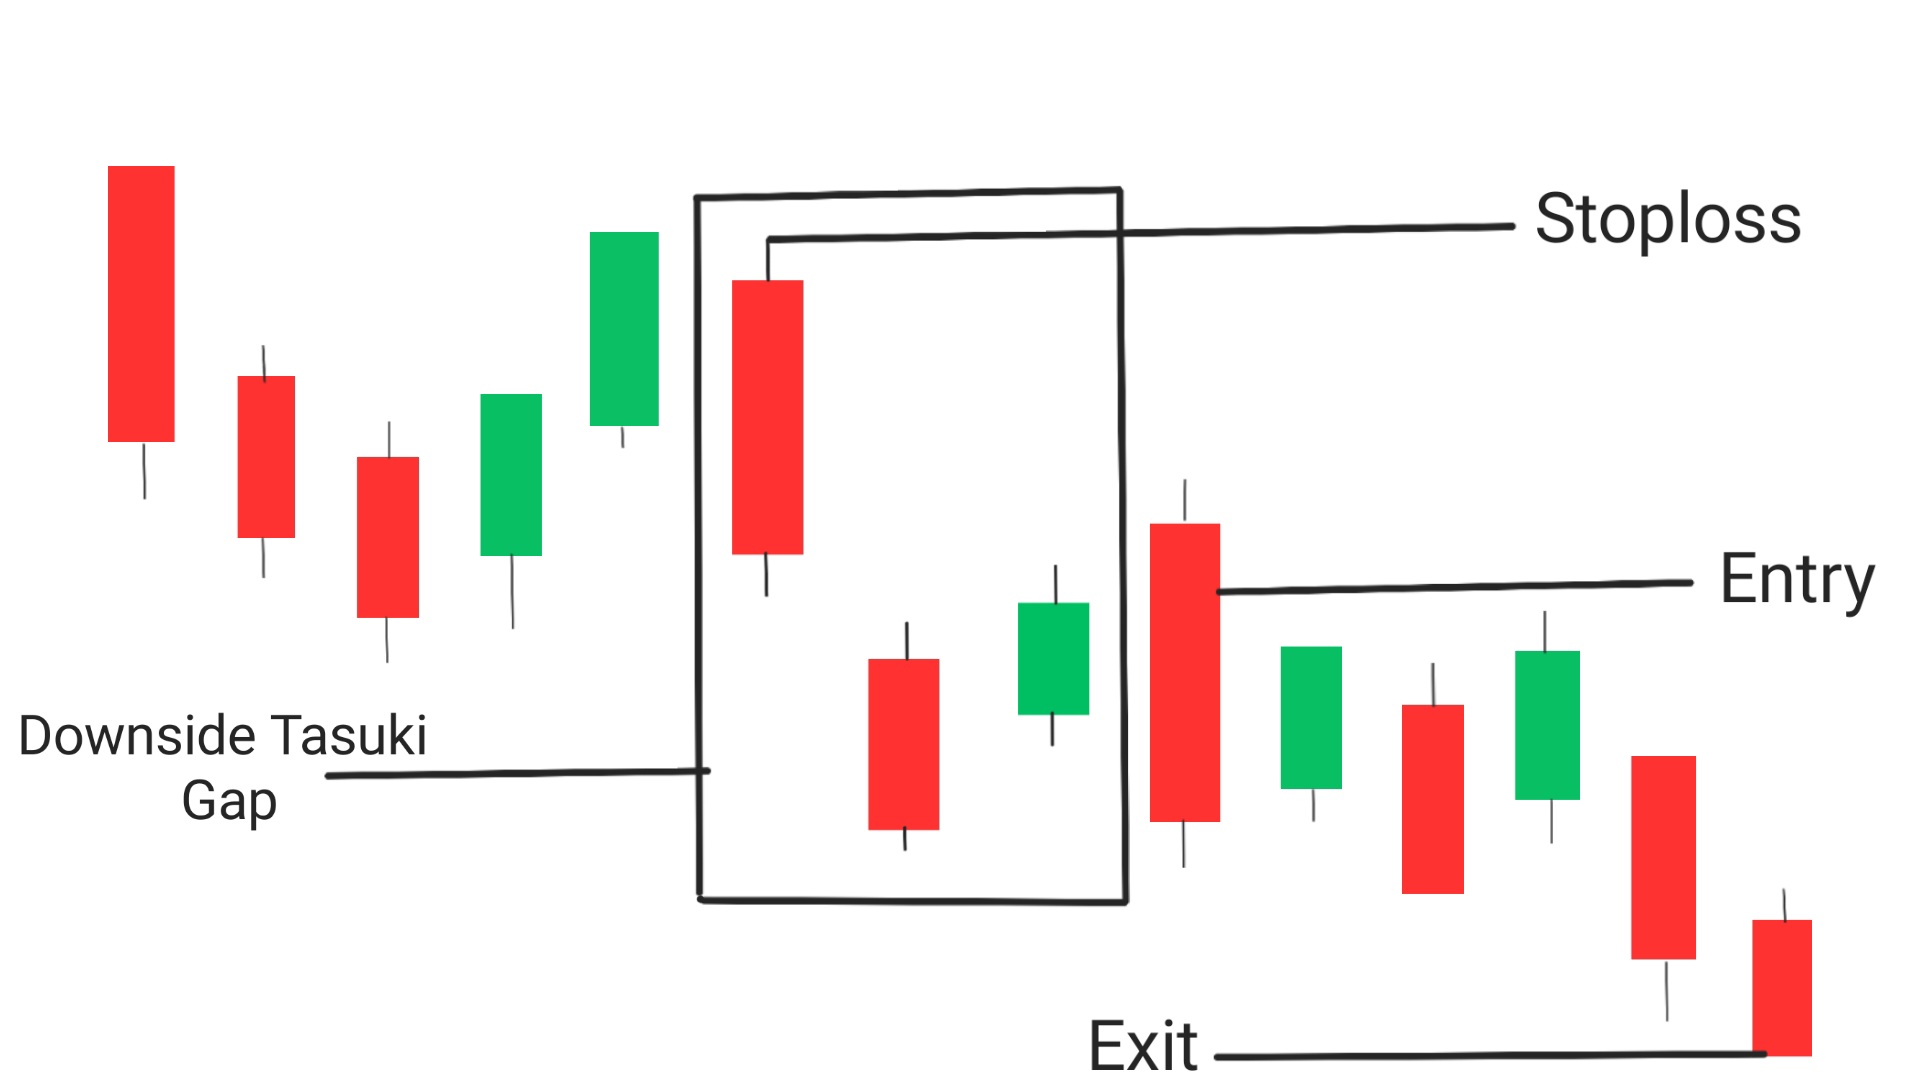
Entry: The best possible entry place to trade while using downside tasuki gap is from the candle next to this pattern which closes below the low of the pattern.
Exit: Exit the trade if you have achieved your goal or the price has reached a significant support level, If you want to trade more look for a breakout near support level, If it happens then take another trade upto a new significant support level.
Stoploss: In order to minimize the risk of stoploss hitting , a stoploss must be set at the high of downside tasuki candlestick pattern.
Following are general procedure to trade using downside tasuki
1. Identify a downtrend: The first step is to identify a downtrend in the market. This can be done by analyzing the price action using technical analysis tools such as moving averages or trend lines.
2. Identify the Tasuki gap: Once a downtrend has been identified, look for a bullish candlestick that gaps down on the open of the next candlestick. This forms the Tasuki gap pattern.
3. Wait for confirmation: Before entering a trade, it is important to wait for confirmation that the pattern is valid. This can be done by waiting for the next candlestick to close below the low of the bullish candlestick that formed the gap.
4. Enter a short trade: Once the pattern is confirmed, enter a short trade with a stop loss above the high of the bullish candlestick. Traders can target profit at previous support levels or using other technical analysis tools such as Fibonacci retracements.
5. Use Stoploss: As with any trade, it is important to manage risk by setting stop losses and taking profits at predetermined levels. Traders should also consider using position sizing and risk management techniques to minimize potential losses.
It is important to note that trading the downside Tasuki gap requires experience and skill in technical analysis and risk management. Traders should also consider using other analysis techniques to confirm the validity of the pattern before entering a trade.
Points to be noted while using downside tasuki pattern,Here are some additional points to consider regarding the Tasuki gap:
1. Not always reliable
Like all technical analysis tools, the Tasuki gap is not always reliable. It can produce false signals or fail to provide a clear indication of market direction. Traders should use the pattern in conjunction with other analysis techniques to increase its effectiveness.
2. Requires experience and skill
The Tasuki gap pattern requires experience and skill to use effectively. Traders need to be able to interpret the pattern correctly and make quick decisions based on market conditions. Novice traders may struggle to use this pattern effectively.
3. Can be influenced by news events
News events and market announcements can impact the effectiveness of the Tasuki gap pattern. Unexpected news can cause sudden price movements that invalidate the pattern or create false signals. Traders need to be aware of upcoming news events when using this pattern.
4. Can be used in combination with other patterns
The Tasuki gap pattern can be used in combination with other candlestick patterns or technical analysis tools to increase its effectiveness. For example, traders may look for confirmation from other indicators such as moving averages or trend lines before making a trading decision based on the Tasuki gap.
Conclusion
The downside Tasuki gap is a bearish candlestick pattern that can provide valuable insights into market trends and potential trading opportunities. It works by indicating a shift in market sentiment from bullish to bearish, with the bears(sellers) taking control of the market. Traders can identify the pattern by looking for a bearish candlestick that gaps down on the open of the next candlestick, followed by a small bullish candlestick that opens within the body of the second bearish candlestick.
Frequently Asked Questions (FAQs)
1.What does the tasuki gap indicate?
The tasuki gap indicates a shift in market sentiment from bullish to bearish, with the bears taking control of the market.
2.What is downside gap pattern?
The downside gap pattern is a bearish candlestick pattern that occurs during a downtrend and consists of a bullish candlestick, followed by a bearish candlestick that gaps down on the open, and finally another bullish candlestick that opens within the body
3.What is bullish tasuki pattern?
The bullish tasuki pattern is a bullish candlestick pattern that occurs during an uptrend and consists of a bearish candlestick, followed by a bullish candlestick that gaps up on the open, and finally another bearish candlestick that opens within the body of the second bullish candlestick.
4.What are the two types of gap?
The two types of gap are the common gap and the breakaway gap.
5.Which gap is called measuring gap?
The measuring gap is a type of breakaway gap that occurs in the middle of a trend and indicates that the trend is likely to continue in the same direction after the gap is filled.