How to Trade Double top pattern? Example With 5 FAQs
The double top pattern is bearish reversal chart pattern which helps in technical analysis that signals a potential trend reversal from bullish to bearish. It is formed when the price of an asset reaches a high point, pulls back, and then reaches that high point again before reversing its trend.

The pattern is quite easy to identify, with two peaks roughly equal in height and a dip in between them, known as the “neckline.” Traders look for confirmation of the pattern by waiting for the price to break below the neckline, indicating a potential downtrend.
What is Double Top Pattern?
The double top pattern is a bearish reversal chart pattern wich means it can convert uptrend into a dowwntrend which helps in technical analysis. It is formed when the price of an asset reaches a high point, then pulls back, and then reaches that high point again before reversing its trend.
This pattern is a signal to traders that the asset’s price is likely to fall. In this article, we will discuss the double top chart pattern in detail, including how to identify it, its significance, and how to trade it. This pattern is also known as ‘M’ Top pattern.
How to Identify the Double Top Pattern?
The double top chart pattern is a relatively easy pattern to identify. It consists of two peaks that are roughly equal in height, with a dip in between them. The dip is referred to as the “neckline” of the pattern. Once the second peak has been formed, traders will look for the price to break below the neckline. This is considered confirmation that the pattern is valid.
Step by step formation of double top chart pattern:-
- The first top must be the highest high of the uptrend.
- At the top price takes resistance and price moves downward.(This downward move can be 10-20% of the previous uptrend)
- The price then takes a support level and starts rising and for one more time price takes resistance at the same level(This 2nd top can vary in between 2-3% more or less than the 1st high)
- The volume at the first top is greater than the volume at the second top.
- The rate of price , moving downward from the secound high is more.
- There must 7-8 candles between the two tops, If it is less than that then it won’t be considered as a valid Double Top Chart Pattern.
- This pattern can be formed in any time frame.
- The difference of candles between two highs can be found below.(on the basis of daily chart)
| Type Of Investment | Gap Between Two highs |
|---|---|
| Intraday Chart | 7-8 Candles Gap |
| Short Term | 3-4 Weeks Gap |
| Medium Term | 3-4 Months Gap |
| Long Term | 1-2 Years or more |
What does Double Top Pattern indicates?
The double top chart pattern is indicates that the trend of the asset has changed from bullish to bearish. This means that traders who were previously long on the asset may want to consider closing their positions or taking profits. Traders who were not previously involved in the asset may want to consider shorting it.
How To Trade Double Top Pattern?
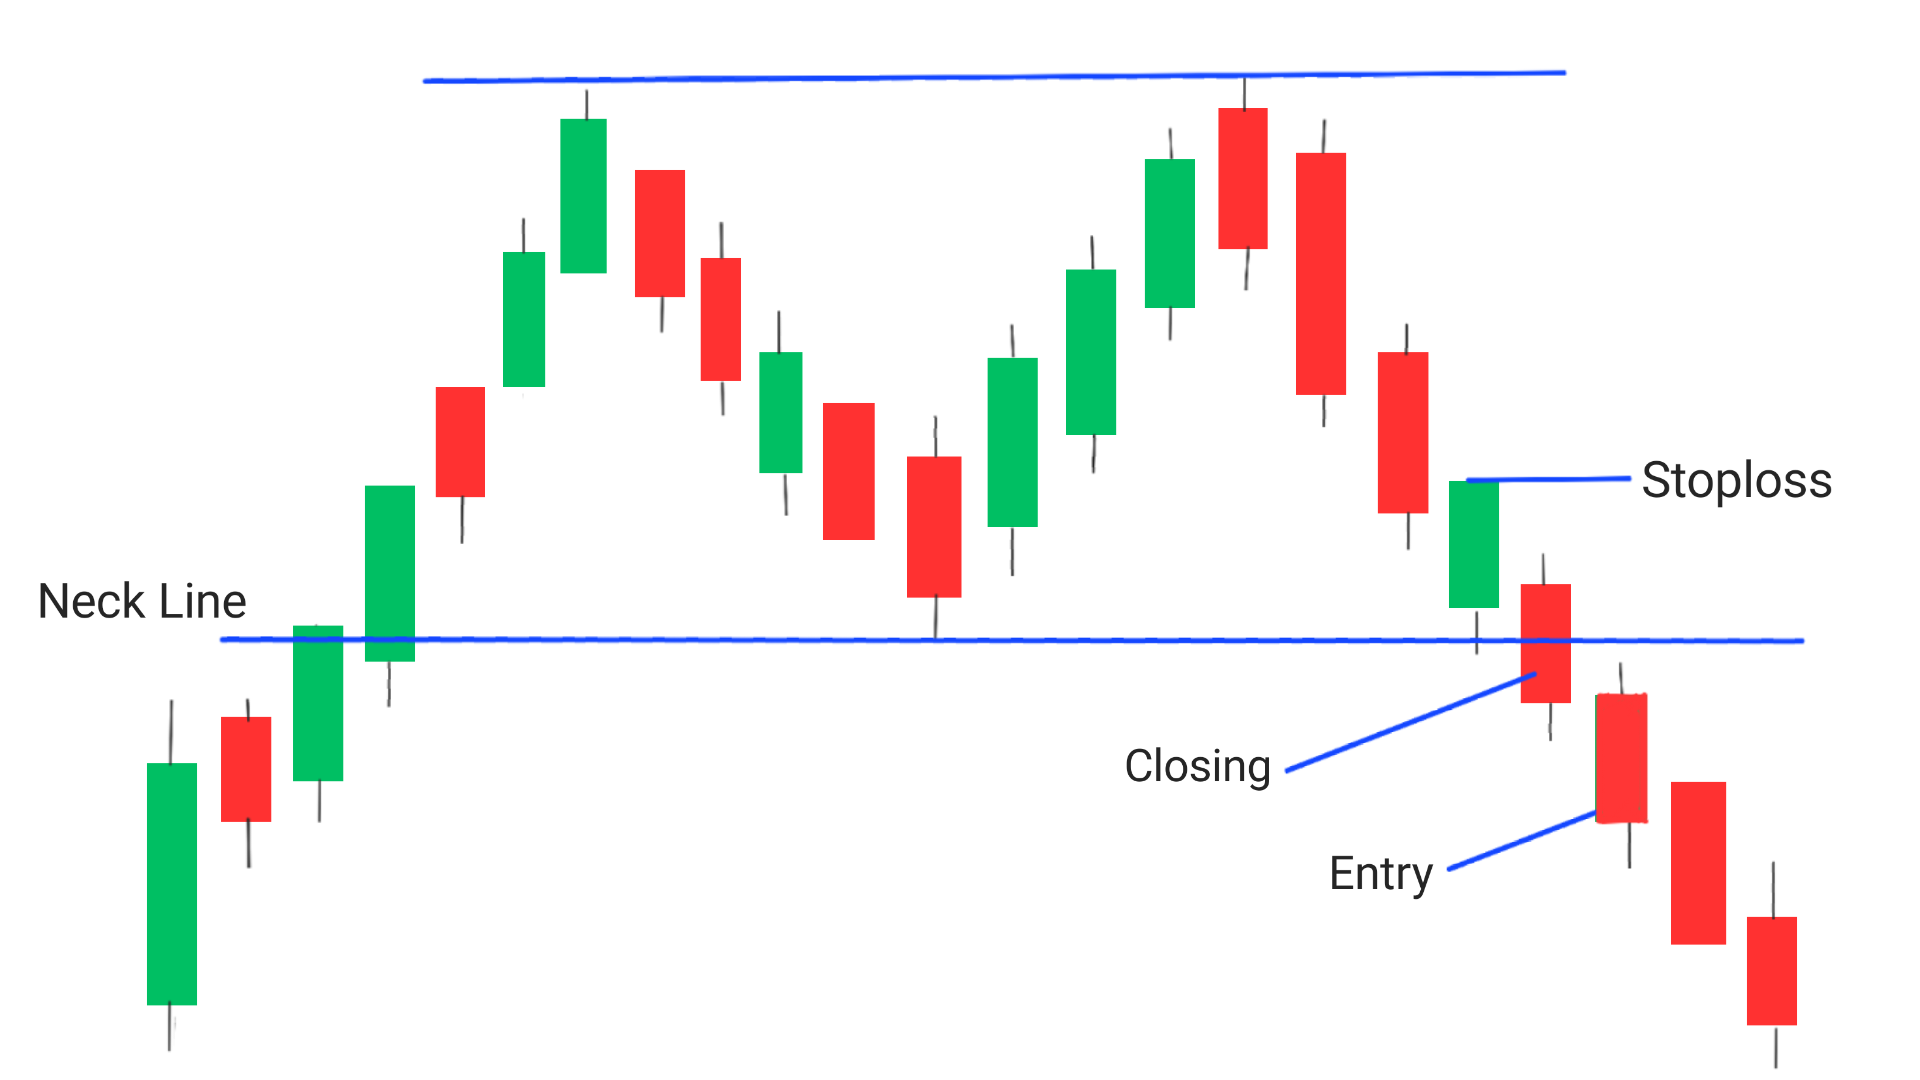
There are several ways to trade the double top pattern. One way is to wait for confirmation of the pattern by waiting for the price to break below the neckline. Once this occurs, traders can enter a short position with a stop loss above the second peak. Example:

To trade the double top pattern, traders typically follow these steps:
1. Identify the pattern: Look for two consecutive peaks that are almost equal in height, with a trough in between them. The Highs should be separated by a atleast 7-8 candles.
2. Draw the neckline : Draw a horizontal line connecting the lows of the pattern between the two peaks. This line is called the neckline.
3. Confirm the pattern: Wait for the price to give breakout below the neckline. This is considered confirmation that the pattern is valid and that a downward trend reversal may be imminent.
4. Double top pattern entry: Once the pattern is confirmed, enter a short position (sell) on the . Traders may also use options or futures contracts to take advantage of the expected downward move.
5. Double top pattern stoploss: In order to reduce the risk of losses, stop-loss orders must be set above the high of the candle previous to the candle which has given breakout.
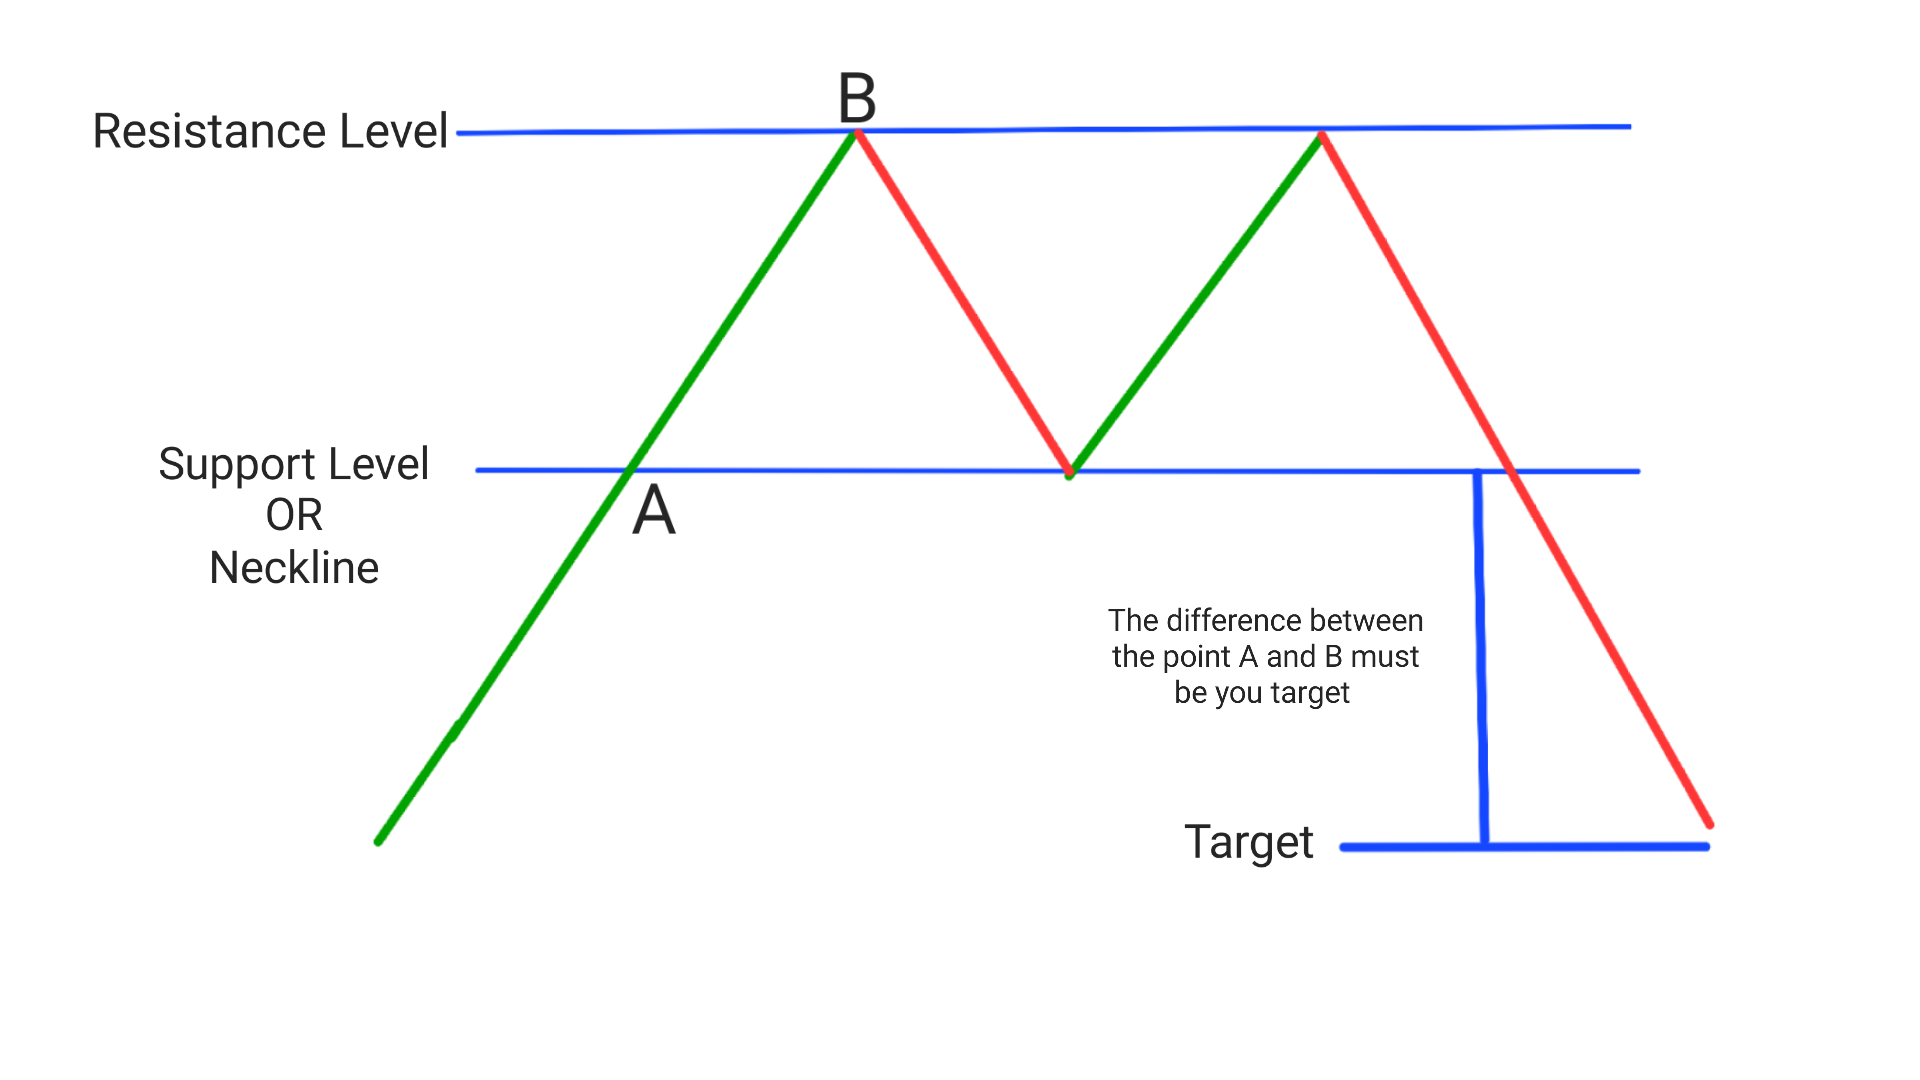
6. Take profits: Exit the trade when the price has covered a distance equal to the difference between the top and low of the pattern below the neckline.
Another way to trade the double top chart pattern is to use it as a target for an existing short position. Traders can place a take-profit order at the level of the neckline, with a stop loss above the second peak.
NOTE: It is important to note that the double top chart pattern is not foolproof and can sometimes be a false signal. Traders should always use other technical indicators and fundamental analysis to take their trading decisions according to price action or their proved strategy.
Double top pattern target
Once the price has given breakout near the resistance level OR the neckline,The target for double top chart pattern must be equal to the difference of distance OR points OR price between the high and neckline, Which is denoted by point B and A.
Pros and cons of Double Top Pattern
Conclusion
The double top pattern is a bearish reversal chart pattern that helps in technical analysis. It is formed when the price of an asset reaches a high point, then pulls back, and then reaches that high point again before reversing its trend. This pattern is significant because it signals that the trend of the asset has changed from bullish to bearish. Traders can use the double top pattern to enter short(sell) positions with target equal to difference between bottom high of pattern.
Frequently Asked Questions(FAQs)
1.Is double top pattern bullish?
No,The double top pattern is generally considered a bearish signal, indicating that the market may be poised for a downward trend reversal. It is not typically viewed as a bullish pattern.
2.How do you play double top pattern?
To play the double top pattern, traders enter short position once the candle gives breakout with target equal to difference between high and neckline.
3.What is the double top technique?
The double top technique is identifying the two peaks of the pattern and drawing a neckline through the trough between them. look for a breakout below the neckline as confirmation that the pattern is valid and that a downward trend reversal may be imminent.
4.Is double top bullish or bearish?
Bearish,The double top pattern is generally considered a bearish signal, indicating that the market may be poised for a downward trend reversal. It is not typically viewed as a bullish pattern.
5.What is the double top pattern in Nifty?
In the case of the Nifty, the double top pattern refers to the formation of two peaks at similar levels, with a trough in between, on the Nifty index chart. It indicates bearish trend reversal.
