Double Bottom Pattern
Technical analysis is an important tool for traders to identify potential trend reversals in the market. One such pattern is the double bottom pattern, which is a bullish reversal pattern that signals the end of a downtrend and the beginning of a new uptrend.
In this blog post, we will explore the double bottom pattern in detail and discuss how traders can use it to make informed trading decisions.

What is the Double Bottom Pattern?
The double bottom pattern is a bullish reversal chart pattern that forms after a downtrend. It consists of two consecutive lows(Bottom that are roughly equal in price, with a peak in between. The pattern is said to be valid when prices break above the peak at resistance level, signaling a potential bullish reversal.
The double bottom pattern is similar to the head and shoulders pattern, but with two lows instead of three. It is also similar to the triple bottom pattern, but with two lows instead of three. This pattern is also known as ‘W’ bottom Pattern.
How to Identify the Double Bottom Pattern
To identify the double bottom pattern, traders should look for the following characteristics:
- The first low must be the lowest low of the downtrend.
- At the 1st low price takes support and price moves upward.(This upward move can be 10-20% of the previous downtrend)
- The price then takes a resistance level and starts declining upto support and for one more time price takes support at the same level and rises to resistance level.(This 2nd low can vary in between 2-3% more or less than the 1st low)
- The volume at the first bottom is greater than the volume at the second top.
- The rate of price , moving upward from the second bottom is more.
- There must 7-8 candles between the two bottom, If it is less than that then it won’t be considered as a valid Double Bottom Chart Pattern.
- This pattern can be formed in any time frame.
- The difference of candles between two bottom can be found below.(on the basis of daily chart)
| Type Of Investment | Gap Between Two highs |
|---|---|
| Intraday Chart | 7-8 Candles Gap |
| Short Term | 3-4 Weeks Gap |
| Medium Term | 3-4 Months Gap |
| Long Term | 1-2 Years or more |
General steps of forming Double Bottom Chart Pattern
1. Downtrend: The previous pattern must be in downtrend, indicating that sellers have been in control of the market.
2. Formation of Two bottoms: The pattern consists of two consecutive lows that are roughly equal in price. The second low should not break below the first low, as this would invalidate the pattern.
3. Peak: The peak between the two bottom should be lower than(10-20%) of the previous downtrend, indicating that sellers are losing momentum.
4. Volume: Volume at the second bottom must be lesser than the first bottom.
5. Breakout: The pattern said to be valid only when prices break above the peak between the two lows, signaling a potential bullish trend reversal.
How to Trade the Double Bottom Pattern
Traders can use the double bottom pattern to make informed trading decisions. Here are some tips for trading the pattern:
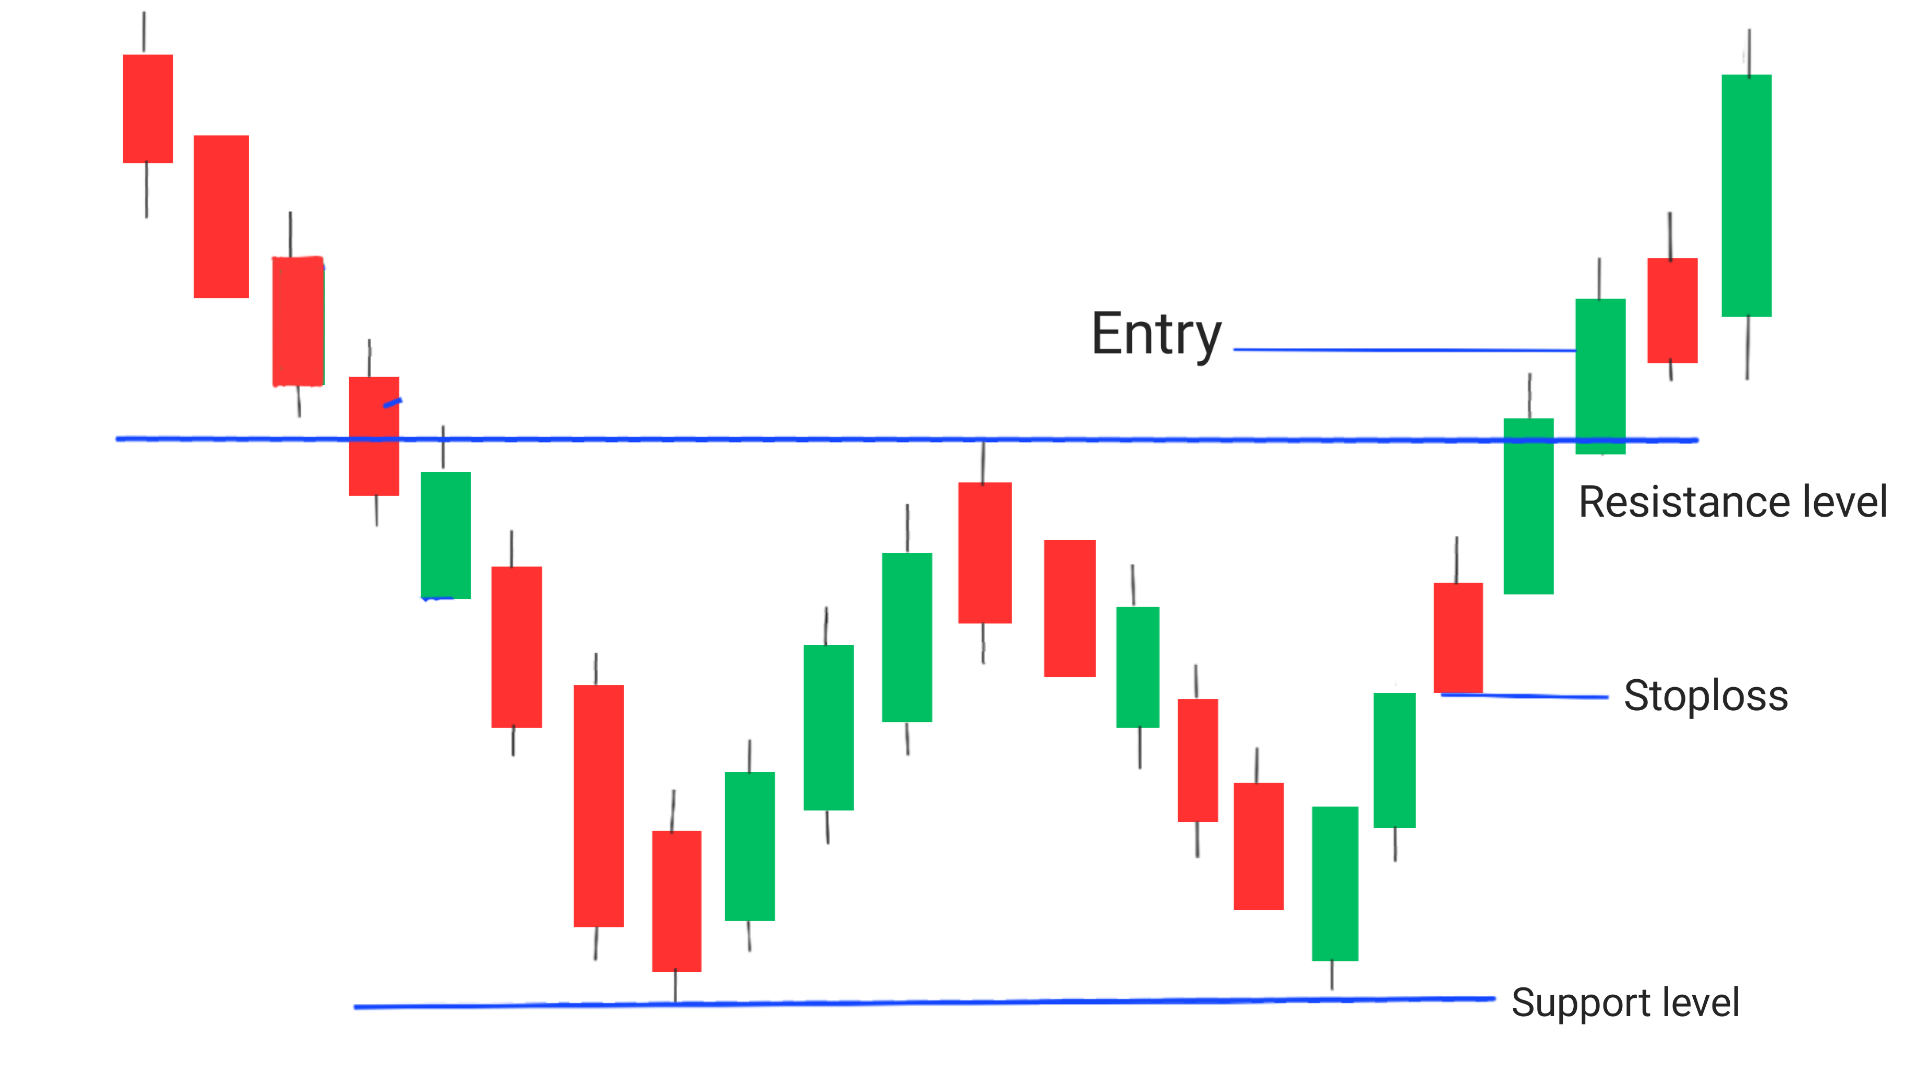
1. Identify the pattern: Look for two consecutive lows that are almost equal in height, with a peak in between them. The bottoms should be separated by a atleast 7-8 candles.
2. Draw the neckline or resistance level: Draw a horizontal line connecting the high of the pattern between the two lows. This line is called the neckline.
3. Confirm the pattern: Wait for the price to give breakout above the neckline. Once the price has given breakout at resistance level This is considered confirmation that the pattern is valid and that a downward trend reversal may be imminent.
4. Double bottom pattern entry: Once the pattern is confirmed, enter a short position (sell) on the . Traders may also use options or futures contracts to take advantage of the expected downward move.
5. Double top pattern stoploss: In order to reduce the risk of losses, stop-loss orders must be set at the low of the candle previous to the candle which has given breakout.
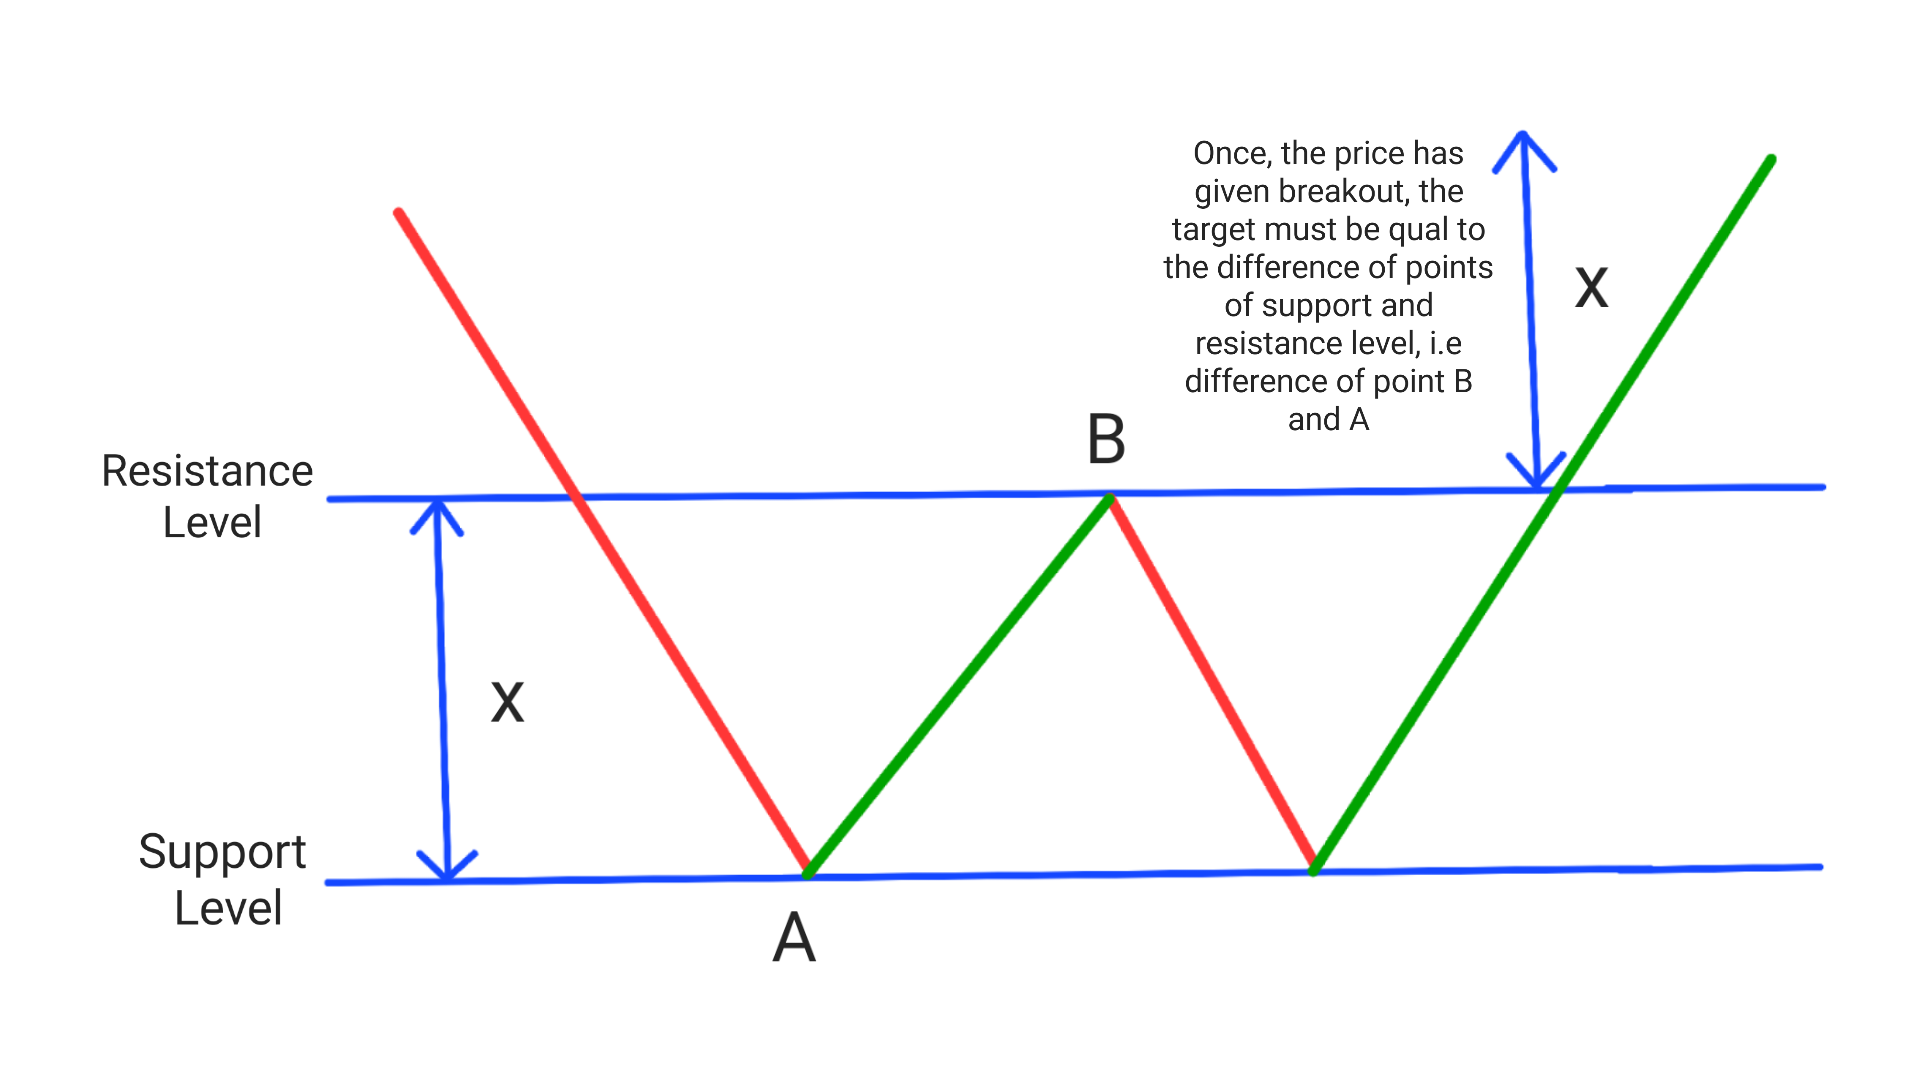
6. Take profits: Exit the trade when the price has covered a distance equal to the difference between the top and low of the pattern below the neckline.
Double Bottom Pattern Target
Once the price has given breakout at the resistance level, Your target must be equal to the difference of points between OR the distance between the support and resistance level and add this distance to the breakout point. This gives a potential target for the uptrend.
Double Top And Double Bottom
A double top pattern is a bearish reversal pattern which forms when the price of an asset hits a resistance level twice, but fails to break through it both times. The two peaks are approximately at the same level, forming a horizontal line, and are separated by a peak in between. Traders typically wait for the price to break below the neckline before entering a short position.
On the other hand, a double bottom stock pattern is a bullish reversal pattern that forms when the price of an asset hits a support level twice, but fails to break below it both the times. The two bottoms are roughly at the same level, forming a horizontal line, and are separated by a peak in between. Traders typically wait for the price to break above the neckline before entering a long position.
In summary, double top and double bottom patterns are similar in their formation but are of opposite nature one is bearish while the other is bullish respectively.
Conclusion
The double bottom pattern is a powerful technical analysis tool that help traders in identifying potential trend reversals in the market.
By following the steps outlined above and combining it with other analysis techniques, traders can increase their chances of success and make informed trading decisions.
Enter trade when price gives breakout, Set stoploss at the low of the candle previous to the the breaking candle amd set target equal to distance between support and resistance level.
Remember to always use proper risk management and stay up-to-date with market trends to maximize your profits and minimize your losses.
Frequently Asked Questions (FAQs)
1.Is double bottom pattern bullish?
Yes, the double bottom pattern is considered a bullish reversal pattern.
2.How do you play double bottom pattern?
To play the double bottom pattern, traders have to look for the price to break above the neckline (the high point between the two bottoms) before entering a long position. The stop loss can be placed below the second bottom with a target eqqual to distance between support and resistance level.
3.What are the three types of double bottom?
The three types of double bottom patterns are:
(i)Standard double bottom: Two bottoms that are approximately equal in price and separated by a peak in between.
(ii)Adam and Eve double bottom: The first bottom is sharp and V-shaped, while the second bottom is more rounded and U-shaped.
(iii)Triple bottom: Three bottoms that are approximately equal in price and separated by two peaks in between.
4.Is double bottom a strategy?
Yes,The double bottom pattern is not a strategy on its own, but it can be used as part of a larger trading strategy.
5.What is the strongest bullish pattern?
The strongest bullish pattern are bullish engulfing, which a high success rate.