
Descending Triangle Pattern is Bullish OR Bearish? 5FAQs
A descending triangle pattern is a popular chart pattern used in technical analysis. It is bearish continuation chart pattern which is formed when the price of an asset creates a series of lower highs, but finds support at a certain level, creating a horizontal line. As the price continues to test this support level, it eventually breaks down and continues to decline.

What is Descending Triangle Pattern?
The descending triangle pattern is a bearish continuation chart pattern that signals a potential bearish trend reversal. It is formed when the price of an asset creates a series of lower highs, but finds support at a certain level, creating a horizontal line which ultimately looks like a descending triangle. As the price continues to test this support level, it eventually breaks down and continues to decline.
The pattern is confirmed when the price breaks below the support level with increased volume. Traders use this pattern to identify potential short-selling opportunities or to exit long positions.
How To Identify Descending Triangle pattern?
To identify a descending triangle pattern on a price chart, you need to look for the following characteristics:
1. Trendlines: Draw a horizontal line connecting at least two or more swing lows (support level) and a descending line connecting lower highs (resistance level). These two trendlines should converge towards each other, forming a triangle shape.
2. Price Action: The price should be making lower highs, indicating that sellers are gradually becoming more aggressive. At the same time, the price should be testing a horizontal support level multiple times without breaking above it.
3. Volume: Typically, volume tends to decrease as the price approaches the apex of the triangle. This signifies a period of consolidation and potential breakout.
4. Duration: The descending triangle pattern can form over several weeks or months, depending on the timeframe of the chart being analyzed. The longer the pattern forms, the more significant the potential breakout may be.
5. Confirmation: Once you have identified the descending triangle pattern, wait for a confirmed breakout. A breakdown below the horizontal support level is considered a bearish signal, suggesting a continuation of the downtrend. Also use indicators to confirme the pattern.
By combining these criteria and observing the price action on the chart, you can effectively identify a descending triangle pattern and anticipate potential trading opportunities based on its implications.
How Descending Triangle Pattern is Formed?
A descending triangle pattern is formed when the price of an asset consolidates within a triangle shape with a horizontal support level and a descending resistance level. Here’s how this pattern is typically formed:
1.Initial Downtrend: The descending triangle pattern usually occurs after a prolonged downtrend in the price of an asset. This downtrend sets the stage for the formation of the pattern and after covering some points price takes support and starts rising.
2. Creates support and Resistance level: Price takes support , then starts rising and after sometime it takes resistance and starts falling down and takes resistance at the same level. This process takes place 2-3 times.
3. Lower Highs: As the price consolidates, sellers continue to push the price lower, creating a series of lower highs. Each subsequent high is lower than the previous one, indicating increasing selling pressure.
3. Horizontal Support: At the same time, buyers step in at a certain price level, creating a horizontal support level. This support level is tested multiple times as the price bounces off it, forming the lower boundary of the triangle. There must be atleast 2 support level, If it is more than 2 then it increases the accuracy of descending triangle pattern.
4. Descending Resistance: On the other side of the triangle, a descending trendline is formed by connecting the lower highs. This trendline acts as a resistance level that pushes the price down whenever it approaches. There must be atleast 2 resistance level, If it is more than 2 it is good for the accuracy of the pattern.
5. Convergence: Over time, the descending resistance level and horizontal support level converge towards each other, forming a triangle shape. This convergence indicates a tightening range and potential breakout in the future.
6. Decreasing Volume: During the formation of the descending triangle pattern, trading volume often decreases as the price approaches the apex of the triangle. This decline in volume signals a period of consolidation and indecision among market participants.
7. Breakout: The descending triangle pattern is typically followed by a breakout to the downside, confirming the continuation of the existing downtrend. Traders often look for increased volume on the breakout as confirmation of the validity of the pattern.
By understanding how a descending triangle pattern is formed and recognizing its key characteristics, traders can anticipate potential trading opportunities and make informed decisions based on the pattern’s implications for future price movements.
How To Trade The Descending Triangle Pattern?
There are several trading strategies that traders can use when identifying the descending triangle pattern. This pattern work well in every time frame.
1. Short-Selling: Traders can enter a short position and take advantage of the bearish trend by short-selling the asset once, It breaks below the support level. This strategy can be risky, as there is always the possibility of a false breakout.
2. Stop-Loss Orders: Traders can use stop-loss orders to limit their losses if the asset breaks above the resistance level especially at the high of the candle previous to the candle which gives breakout. This strategy can help traders minimize their risk and protect their capital.
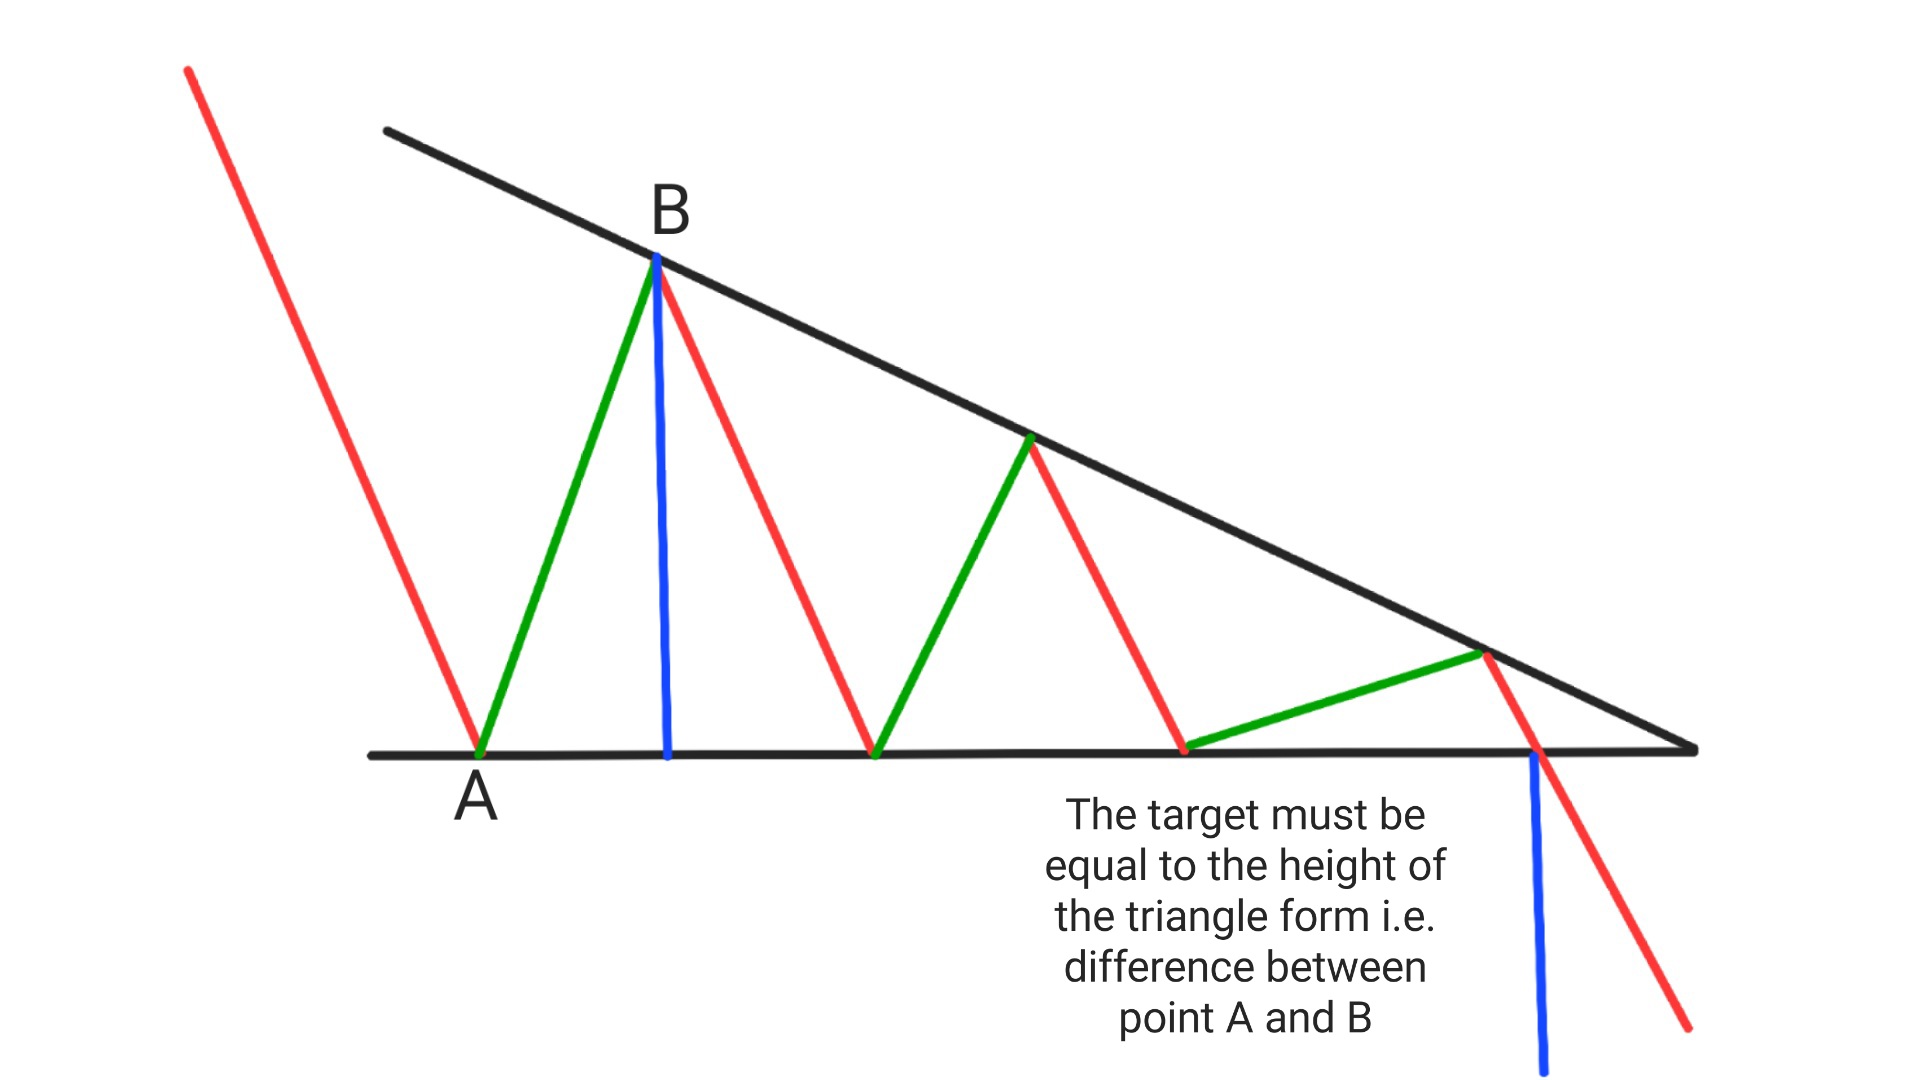
3. Price Targets: Traders can use the height of the triangle i.e. the distance between the 1st support and resistance level to determine potential price targets. This is done by measuring the distance between the highest high and the support level, and projecting it downwards from the breakout point.
Conclusion
The descending triangle pattern is a popular chart pattern used in technical analysis. It is formed when the price of an asset creates a series of lower highs, but finds support at a certain level, creating a horizontal line. Traders use this pattern to identify potential short-selling opportunities or to exit long positions. It is important to note that this pattern can be risky, and traders should always use proper risk management techniques when trading.
Ascending Triangle Vs Descending triangle Pattern
The ascending triangle and descending triangle patterns are two common chart patterns that traders use to analyze price movements and make trading decisions. Here are the key differences between the two patterns:
1. Formation:
- Ascending Triangle: In an ascending triangle pattern, the price consolidates within a triangle shape with a horizontal resistance level and an ascending support level. The ascending support level indicates increasing buying pressure, while the horizontal resistance level acts as a barrier that needs to be broken for a potential bullish breakout.
- Descending Triangle: In a descending triangle pattern, the price consolidates within a triangle shape with a horizontal support level and a descending resistance level. The descending resistance level indicates increasing selling pressure, while the horizontal support level acts as a key level that needs to be breached for a potential bearish breakout.
2. Implications:
- Ascending Triangle: The ascending triangle pattern is considered a bullish continuation pattern. Traders interpret this pattern as a sign of accumulation and expect the price to break out to the upside, continuing the existing uptrend.
- Descending Triangle: The descending triangle pattern is considered a bearish continuation pattern. Traders view this pattern as a sign of distribution and anticipate the price to break out to the downside, continuing the existing downtrend.
3. Volume:
- Ascending Triangle: During the formation of an ascending triangle pattern, traders often look for decreasing volume as the price approaches the apex of the triangle. A breakout to the upside with increased volume is seen as a confirmation of the pattern.
- Descending Triangle: Similarly, in a descending triangle pattern, traders typically observe decreasing volume as the price nears the apex of the triangle. A breakout to the downside with higher volume is considered a validation of the pattern.
4. Breakout Direction:
- Ascending Triangle: Traders expect a breakout in an ascending triangle pattern to occur to the upside, indicating a potential bullish move.
- Descending Triangle: Conversely, in a descending triangle pattern, traders anticipate a breakout to the downside, signaling a potential bearish move.By understanding the differences between ascending and descending triangle patterns, traders can better analyze market conditions and make informed decisions based on the implications of each pattern for future price movements.
Frequently Asked Questions(FAQs)
1.What happens after descending triangle pattern?
After a descending triangle pattern, there is typically a breakout to the downside as the price continues its downward trend.
2.What is a descending pattern?
A descending triangle pattern is a technical analysis chart pattern formed by drawing two trendlines: a horizontal line representing a support level and a descending line representing lower highs. This pattern suggests that the price is likely to break out to the downside.
3.What is the psychology behind the descending triangle pattern?
The psychology behind the descending triangle pattern is that sellers are gradually becoming more aggressive, pushing the price lower each time it rallies to the resistance level. This creates a sense of bearishness among traders, leading to a potential breakdown in price.
4.Can a descending triangle be bullish?
No,While descending triangles are typically considered bearish patterns, there can be instances where they break out to the upside, known as a bullish descending triangle. This may occur if there is a strong buying pressure that overcomes the resistance level.
5.What is the success rate of the descending triangle pattern?
The success rate of the descendingis nearly 90%, Which means for every 10 trades takes , you can easily make profit in 9 out of those 10.