How to Trade Bull flag vs bear flag? 5 FAQs
When it comes to trading, it is important to understand different chart patterns that can occur in the market.
Two of the most commonly used patterns are the bull flag and bear flag. These patterns are used to identify potential bullish and bearish trend continuations and can be used to make profitable trades.
In this blog post, we will explore what bull flags and bear flags are, how they are formed, and how they can be used in trading.

What is a Bull Flag Pattern?
A bull flag pattern is a bullish continuation chart pattern that occurs when there is a strong uptrend in the market. The pattern is characterized by a short period of consolidation making 3 resistance and support levels, followed by a continuation of the uptrend. The consolidation period is represented by a downward sloping channel, or flag, that forms as prices move sideways.
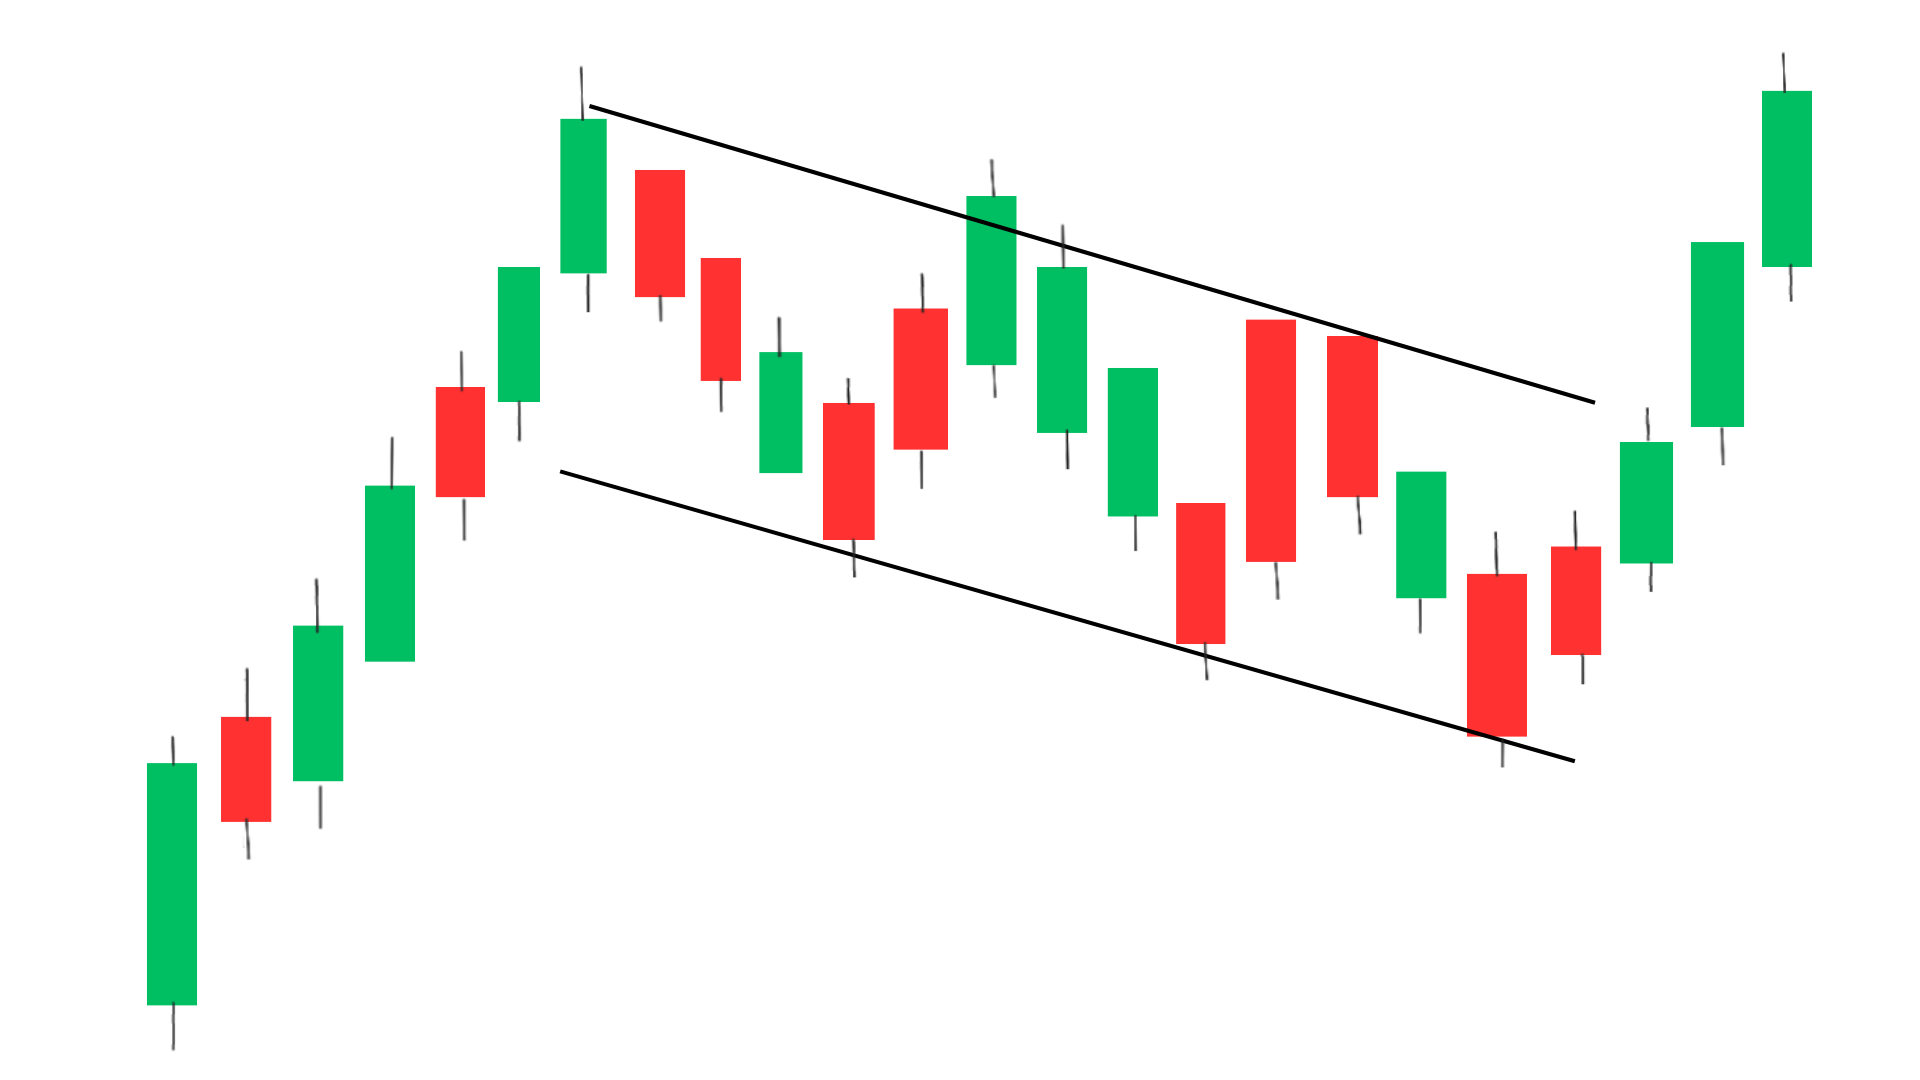
The flag is formed as traders take profits after the initial uptrend, causing prices to consolidate. As the consolidation period continues, buyers step back into the market and push prices higher, continuing the uptrend.
The key to identifying a bull flag pattern is to look for a strong uptrend followed by a period of consolidation. The consolidation period should be represented by a downward sloping channel or flag that lasts for at least several days.
Once the pattern has been identified, traders can enter a long position when prices break above the upper trendline of the flag. This signals that the uptrend is continuing and that prices are likely to move higher.
How Bull Flag Pattern is formed?
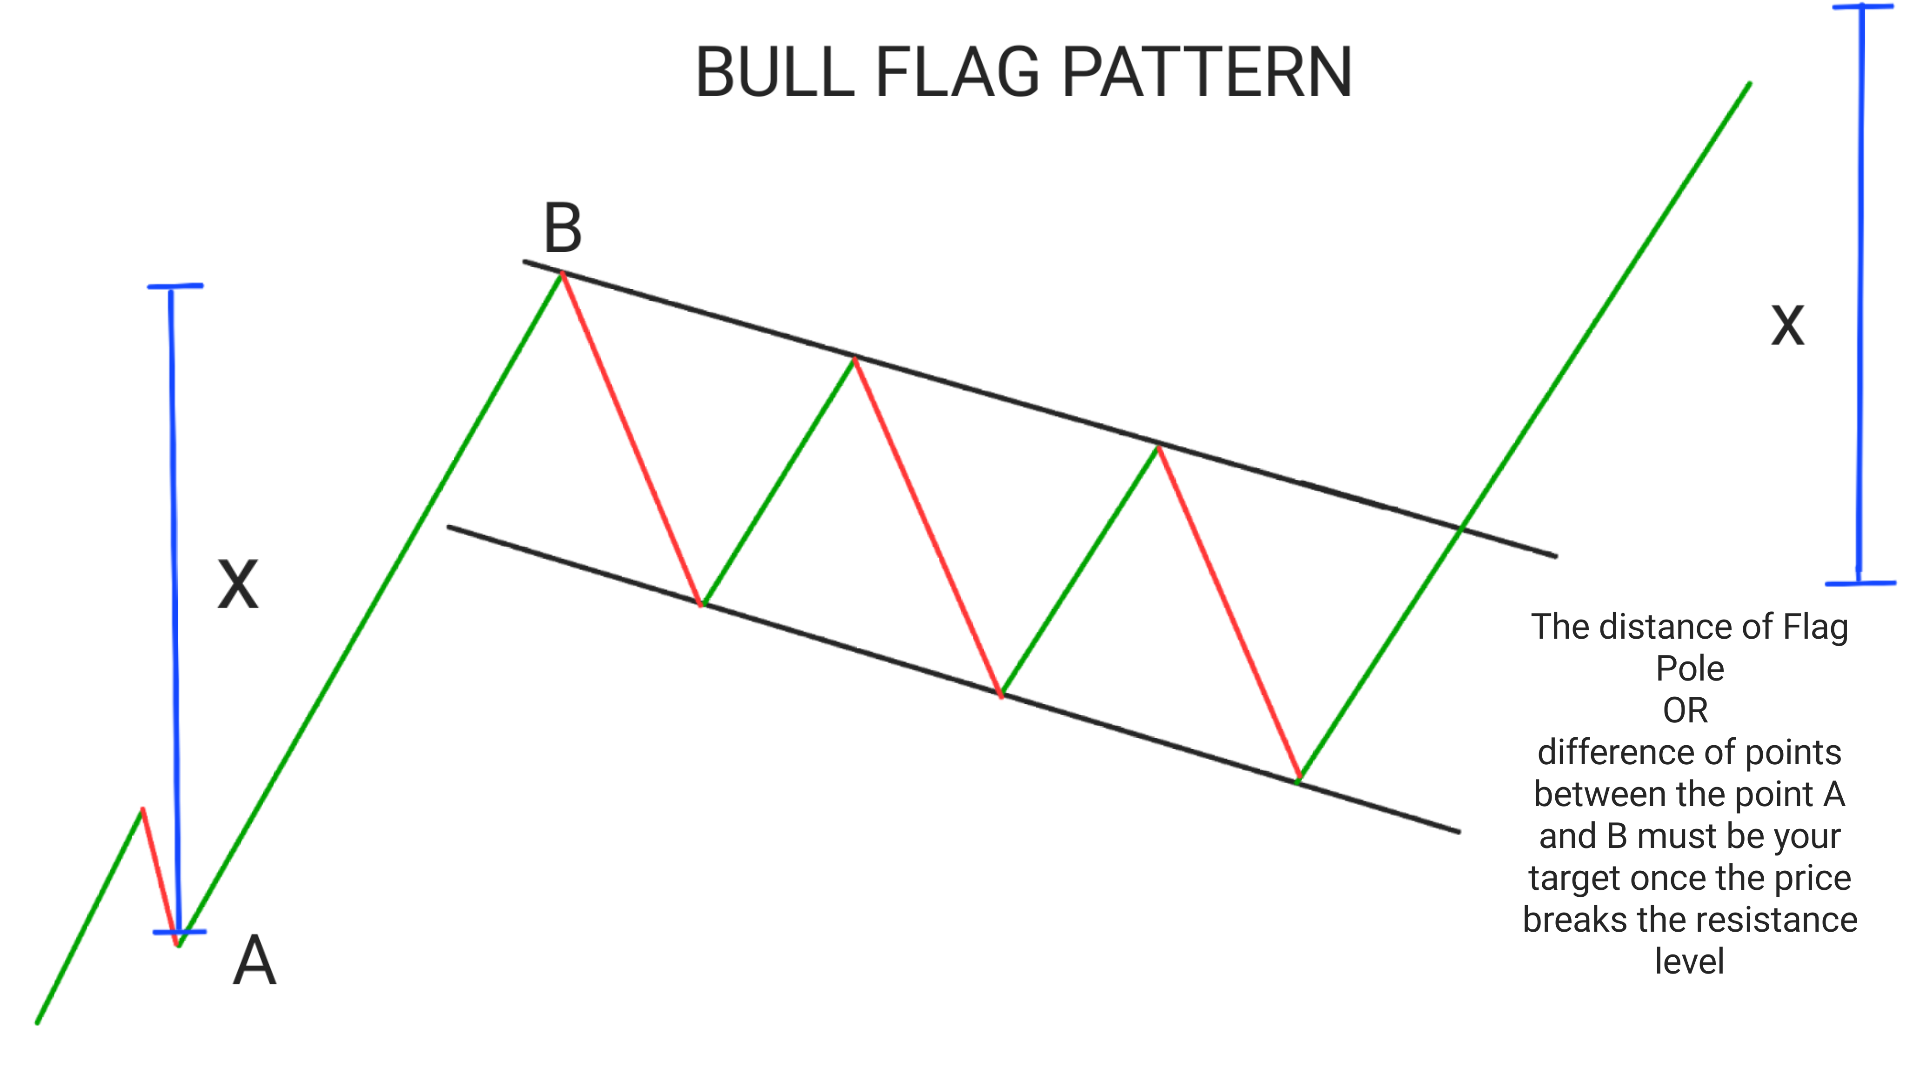
1.Initial price movement was in sharp uptrend(also known as Flag Pole), After few time it takes resistance and price goes into consolidation period.(volume at the top is greater than during the consolidation period.
2.In this consolidation period 3 resistance levels and support level are created.
3.Draw two lines(i) Touching the resistance of at both the points and (ii) Touching the support level . This two lines must be parallel to each other.
4. When a candle give breakout at the resitance then it is considered as a valid bull flag pattern.( Volume of candle is increases as soon as it gives breakout)
What is a Bear Flag Pattern?
A bear flag pattern is the opposite of a bull flag pattern. It is a bearish continuation chart pattern that occurs when there is a strong downtrend in the market. The pattern is characterized by a brief period of consolidation creating 3 support and resistance levels, followed by a continuation of the downtrend. The consolidation period is represented by an upward sloping channel, or flag, that forms as prices move sideways.
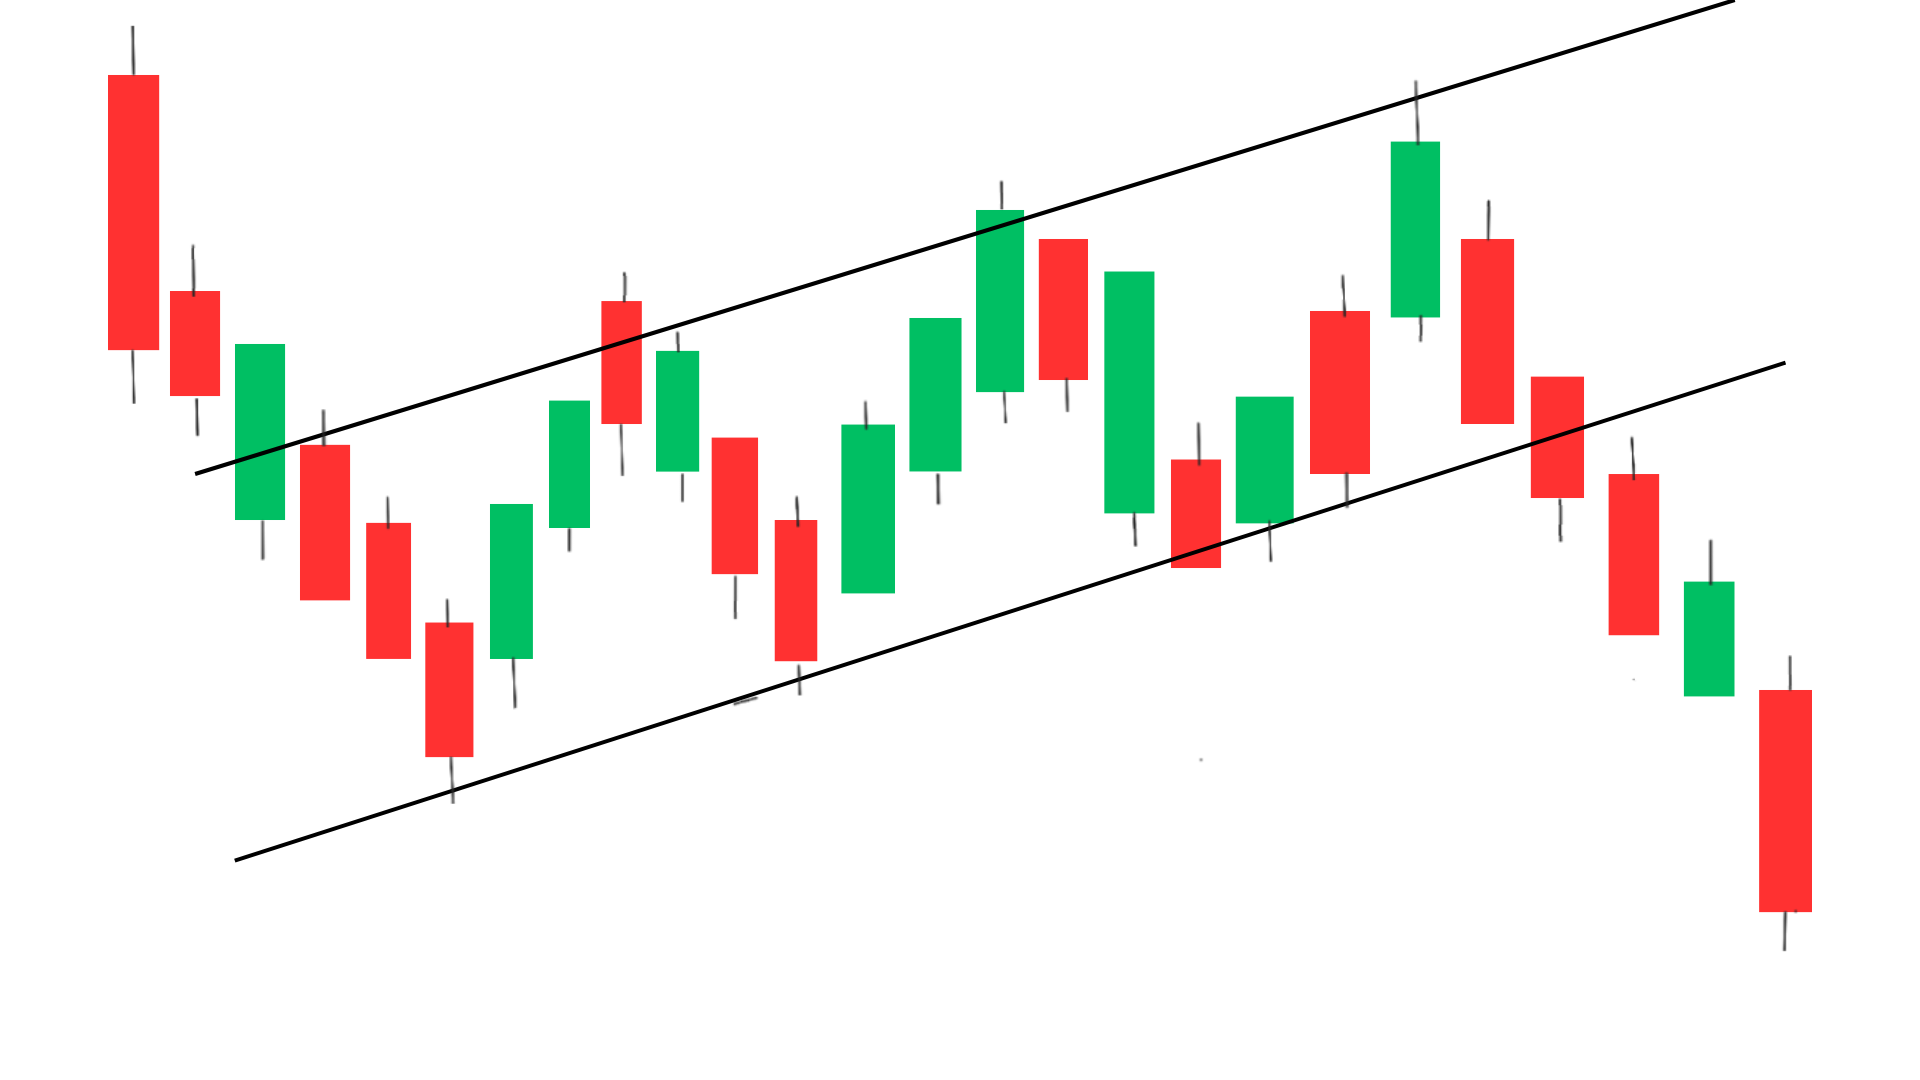
The flag is formed as traders take profits after the initial downtrend, causing prices to consolidate. As the consolidation period continues, sellers step back into the market and push prices lower, continuing the downtrend.
The key to identifying a bear flag pattern is to look for a strong downtrend followed by a period of consolidation. The consolidation period should be represented by an upward sloping channel or flag that lasts for at least several days.
Once the pattern has been identified, traders can enter a short position when prices break below the lower trendline of the flag. This signals that the downtrend is continuing and that prices are likely to move lower.
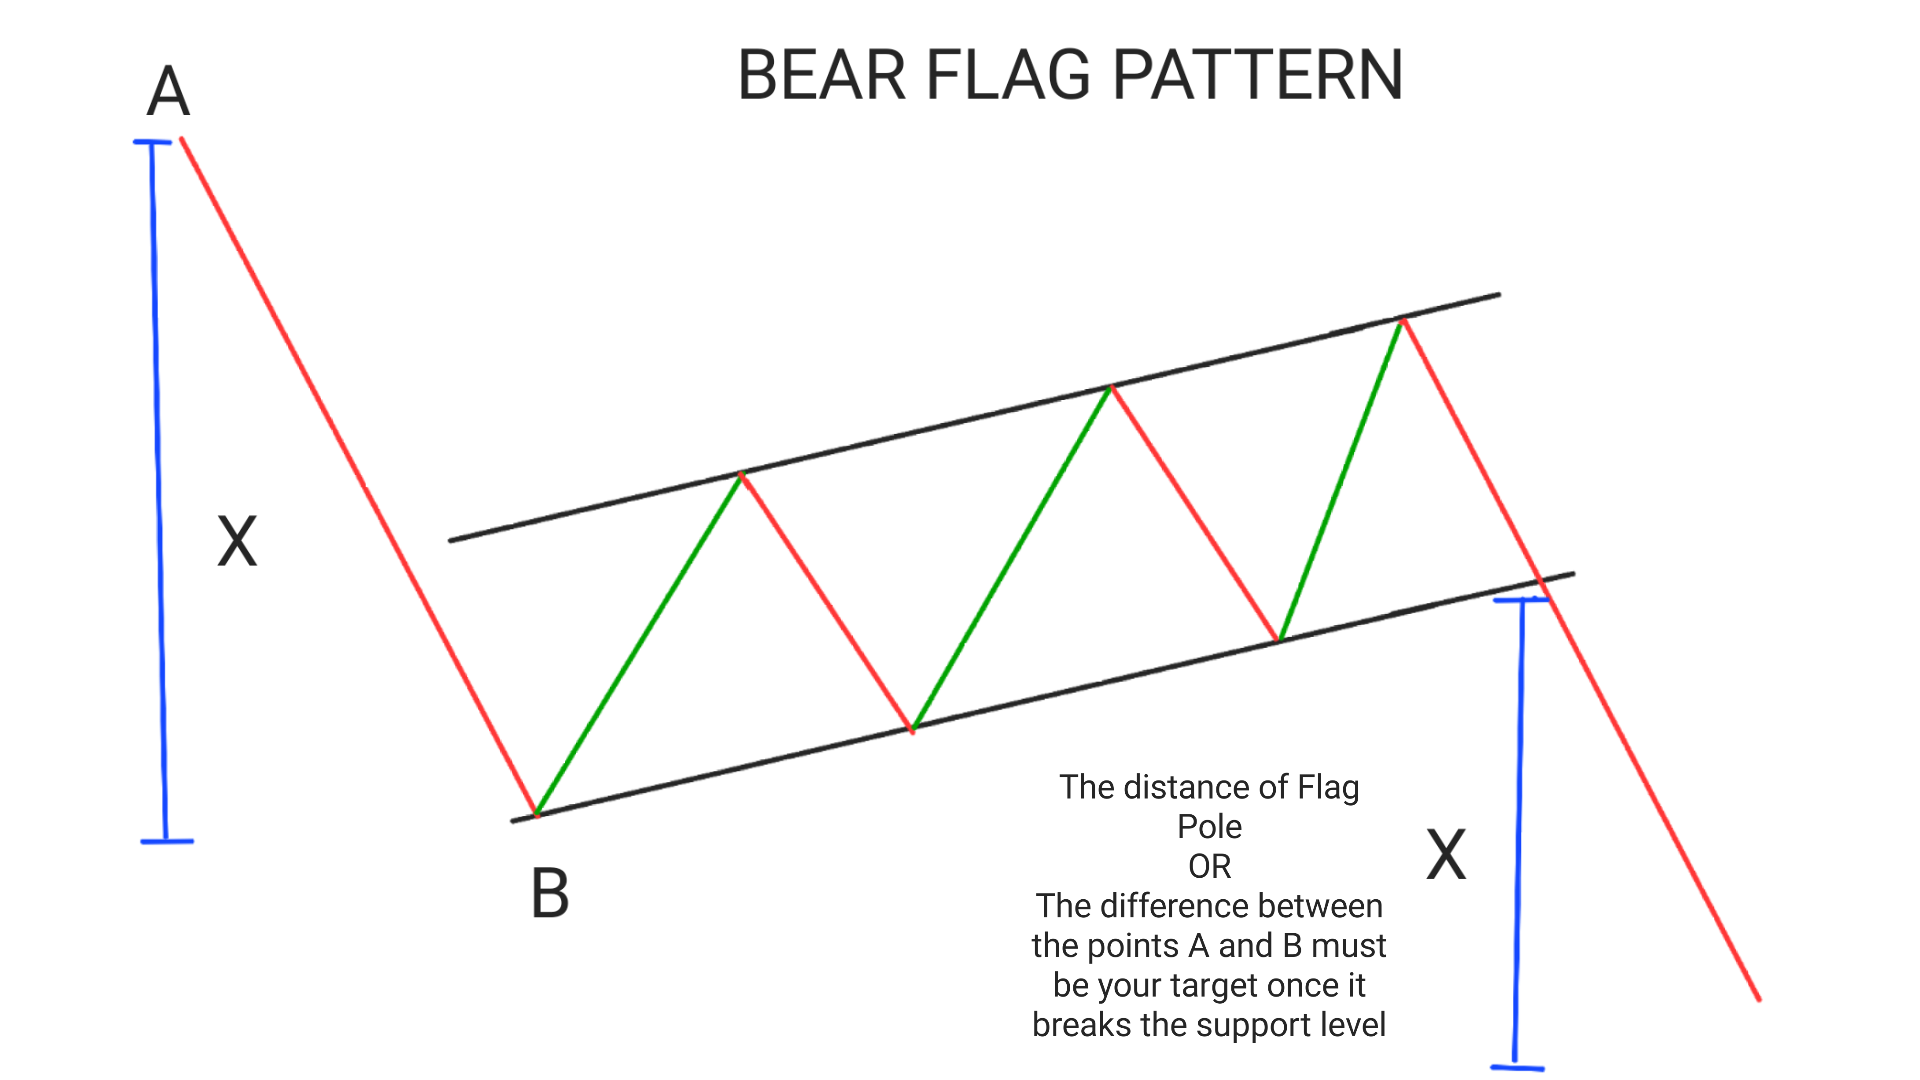
How Bear Flag Pattern is Formed?
1.Initial price movement was in sharp downtrend (also known as Flag Pole), At its peak, it takes support and price goes into consolidation period.(volume at the top is greater than during the consolidation period.
2.In this consolidation period 3support levels and resistance level are created.
3.Draw two lines(i) Touching the support of at both the points and (ii) Touching the resistance level . This two lines must be parallel to each other.
4. When a candle give breakout at the support level then it is considered as a valid bear flag pattern.( Volume of candle is increases as soon as it gives breakout)
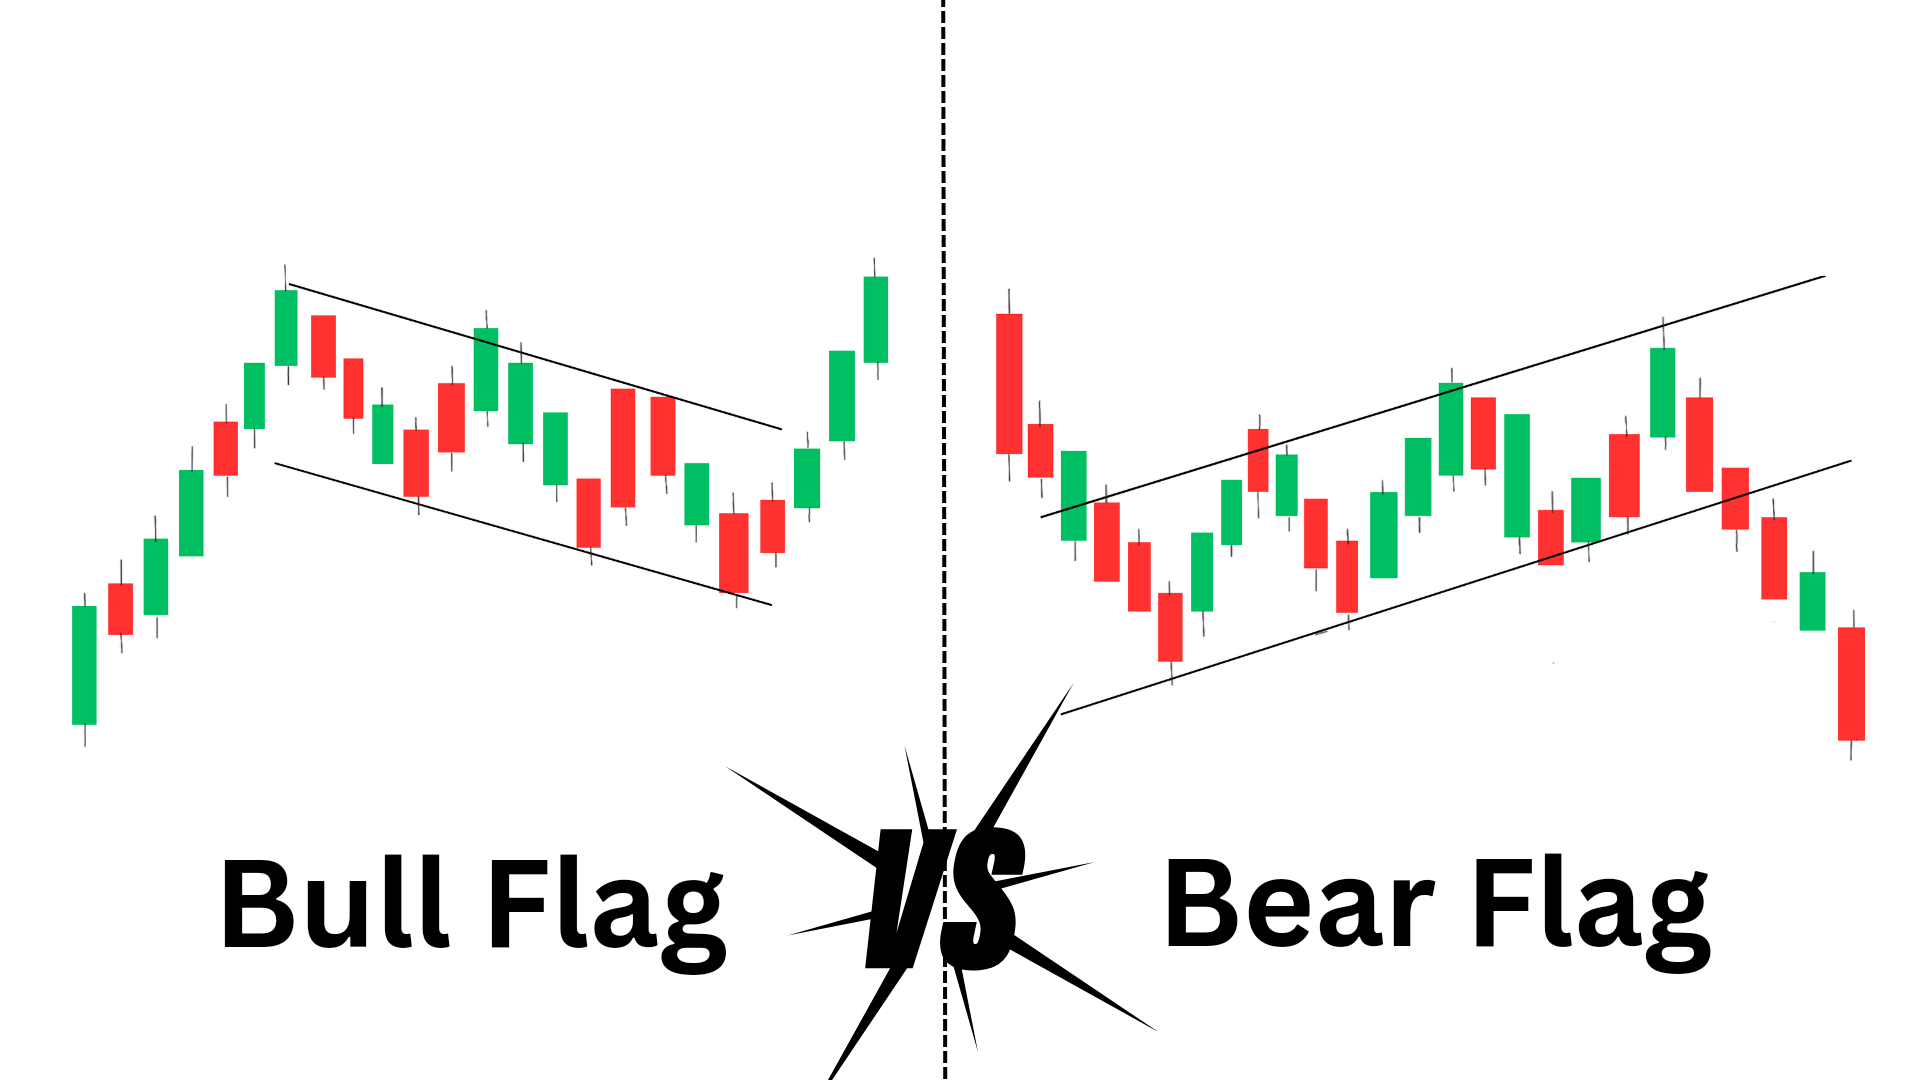
What is Differences Between Bull Flag and Bear Flag Patterns
While bull flag and bear flag patterns are similar in their formation, there are some key differences between the two patterns.
1.Firstly, bull flag patterns occur during uptrends, while bear flag patterns occur during downtrends. This means that traders can use different signals depending on whether they are trading a bull flag or a bear flag.
2.Secondly, the flags themselves are different. A bull flag is characterized by a downward sloping price channel, while a bear flag is characterized by an upward sloping price channel. This reflects the fact that buyers are more active during a bull flag pattern, while sellers are more active during a bear flag pattern.
3.Finally, the entry points for traders are different for each pattern. In a bull flag pattern, traders will enter a long position when prices break above the upper trendlineow of the flag. In a bear flag pattern, traders will enter a short position when prices break below the lower trendline of the flag.
Top Bestseller mastermind book to learn trading from scratch along with examples click here.
How to Trade Bull Flag vs Bear Flag Patterns
Now that we have discussed what bull flag and bear flag patterns are and how they differ, let’s take a look at how traders can use these patterns in their trading.
How to trade Bull Flag Pattern?
To trade a bull flag pattern, in this example you can follow these steps:
1. Identify the bull flag pattern: Look for a sharp price increase followed by a consolidation period where the price moves in a narrow range, forming a flag shape.
2. Confirm the pattern: Check that the consolidation period is not too long and the volume during the consolidation is lower than during the initial price increase. If it gives breakout then only it will be considered as Bull Flag Pattern.
3. Set your entry point: Once you have confirmed the pattern, set your entry point slightly above the upper trendline of the flag.
4. Set your stop loss: Place a stop loss oorderat the low of the candle previous to the the candle which gives breakout at he resistance level.
5. Bull Flag Pattern target: Calculate your profit target by measuring the height of the flagpole (the initial price increase) and adding it to the breakout point. This will give you an idea of how much profit you can make.
How to trade Bear Flag Pattern?
To trade a bear flag pattern, you can follow these steps:
1. Identify the bear flag pattern: Look for a sharp price decrease followed by a consolidation period where the price moves in a narrow range, forming a flag shape.
2. Confirm the pattern: Check that the consolidation period is not too long and the volume during the consolidation is lower than during the initial price decrease. If the price breaks the resistance level, THen only it will be considered as a valid bear flag pattern.
3. Set your entry point: Once you have confirmed the pattern, set your entry point at the candle which breaks and closes below the support line.
4. Set your stop loss: Place a stop loss order at the high of the candle previous to the candle which breaks the support level.
5. Bear Flag Pattern target: Calculate your profit target by measuring the height of the flagpole (the initial price decrease) and subtracting it from the breakout point. This will give you an idea of how much profit you can make.
Success rate of Bull flag Vs Bear Flag
The success of rate of bull flag and bear flag pattern are nearly 85%, which means for every 10 trades taken you will be able to make profit in more than 8 out of those trades.
conclusion
Bull flag pattern vs bear flag patterns In summary, a bull flag pattern is a bullish continuation pattern that occurs after a price increase, while a bear flag pattern is a bearish continuation pattern that occurs after a price decrease.
Both patterns are characterized by a consolidation period in which the price moves in a narrow range, forming a flag shape.
Traders can use these patterns to identify potential trading opportunities and set their entry, stop loss, and profit target levels accordingly.
Frequently Asked Questions(FAQs)
1.What is the difference between a bear flag and a bull flag?
The difference between the two is their direction and what they indicate. A bull flag is a bullish continuation pattern that occurs when the price of an asset experiences a strong upward trend followed by a brief period of consolidation or sideways movement.
This consolidation is often represented by a rectangular shape on a chart, with the upper and lower lines forming a flagpole. The bullish continuation signal occurs when the price breaks above the upper line of the flag.
On the other hand, a bear flag is a bearish continuation pattern that occurs when the price of an asset experiences a strong downward trend followed by a brief period of consolidation or sideways movement.
This consolidation is also represented by a rectangular shape on a chart, with the upper and lower lines forming a flagpole. The bearish continuation signal occurs when the price breaks below the lower line of the flag.
conclusion, a bear flag is considered a bearish continuation signal as it indicates that the price of an asset is likely to continue its downward trend. while, a bull flag is considered a bullish continuation signal as it indicates that the price of an asset is likely to continue its upward trend.
2.What does a bull flag indicate?
A bull flag is a bullish continuation pattern that indicates that the price of an asset is likely to continue its upward trend.
3.What is bear flag in trading?
A bear flag is a bearish continuation pattern in trading that indicates that the price of an asset is likely to continue its downward trend.
4.Is a bear flag bullish?
No, a bear flag is not bullish. It is a bearish signal.
5.Is a bull flag bearish or bullish?
Bullish,A bull flag is a bullish signal, not bearish.