
The Tweezer Top Pattern
The tweezer top pattern is a popular technical analysis tool used by traders to identify potential trend reversals in the market. This pattern is formed when two or more candlesticks have the same high price, indicating a resistance level that the market is struggling to break through. In this blog post, we will explore the tweezer top in detail, including how it works, how to identify it, and how to use it in your trading strategy.
What is the Tweezer Top Pattern?
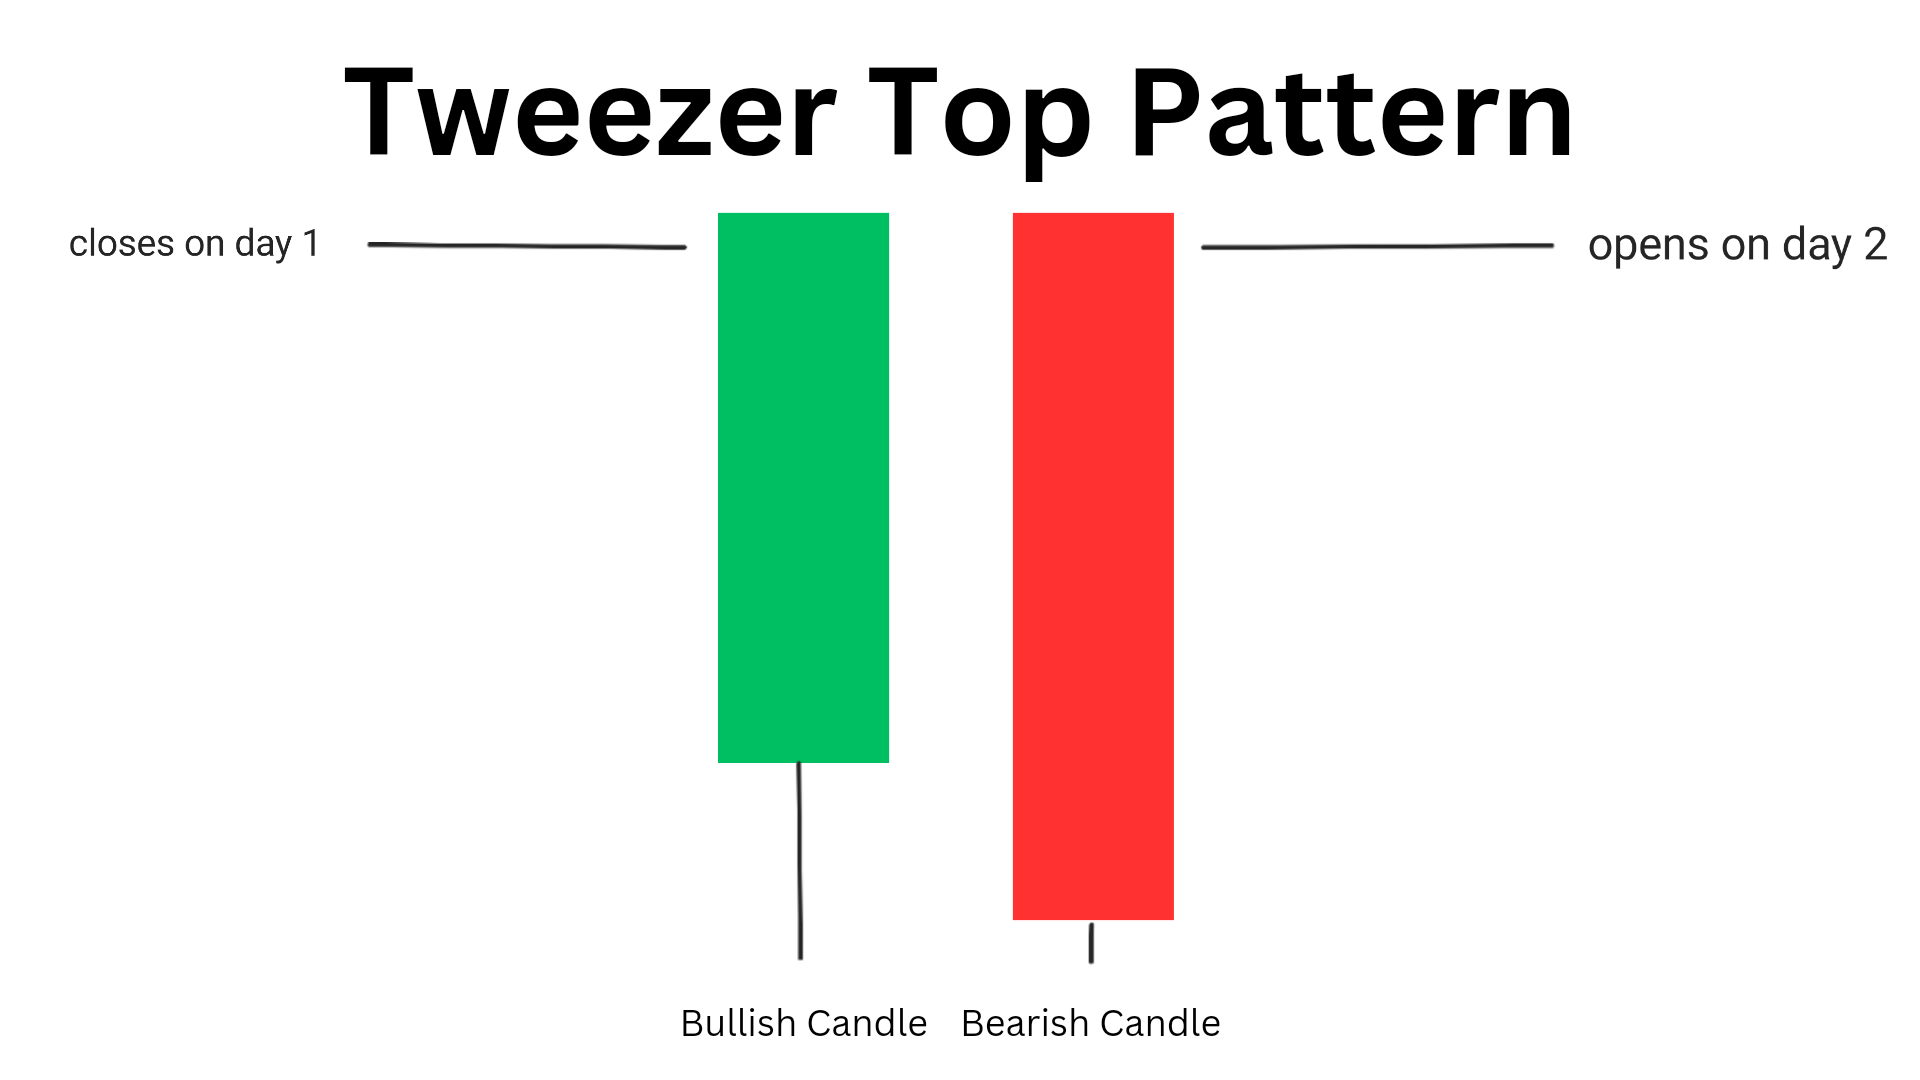
The tweezer top pattern is a two candlestick bearish reversal pattern means it can convert uptrend into downtrend, that forms at the top of an uptrend. This pattern is formed when two or more candlesticks have the same high price. This pattern consists of two candle: one is bullish and other is bearish
- The first candle is a bearish candle (green or white) formed at the end of the day 1. This candle signifies an upward momentum in the market which means that buyers were in control and dominating the market by pushing the price higher.
- The second candle is a bearish candle (red or black) is formed on the next day i.e. on day 2 . It signifies a downward movement in the market which means buyers are losing the control and sellers are taking the charge.
This pattern is maibny formed when the market is struggling to break through a resistance level, and the price action forms a double top. The tweezer top is a bearish reversal pattern, indicating that the market may be about to turn lower.
How to Identify the Tweezer Top Candlestick Pattern?
To identify the tweezer top , you need to look for
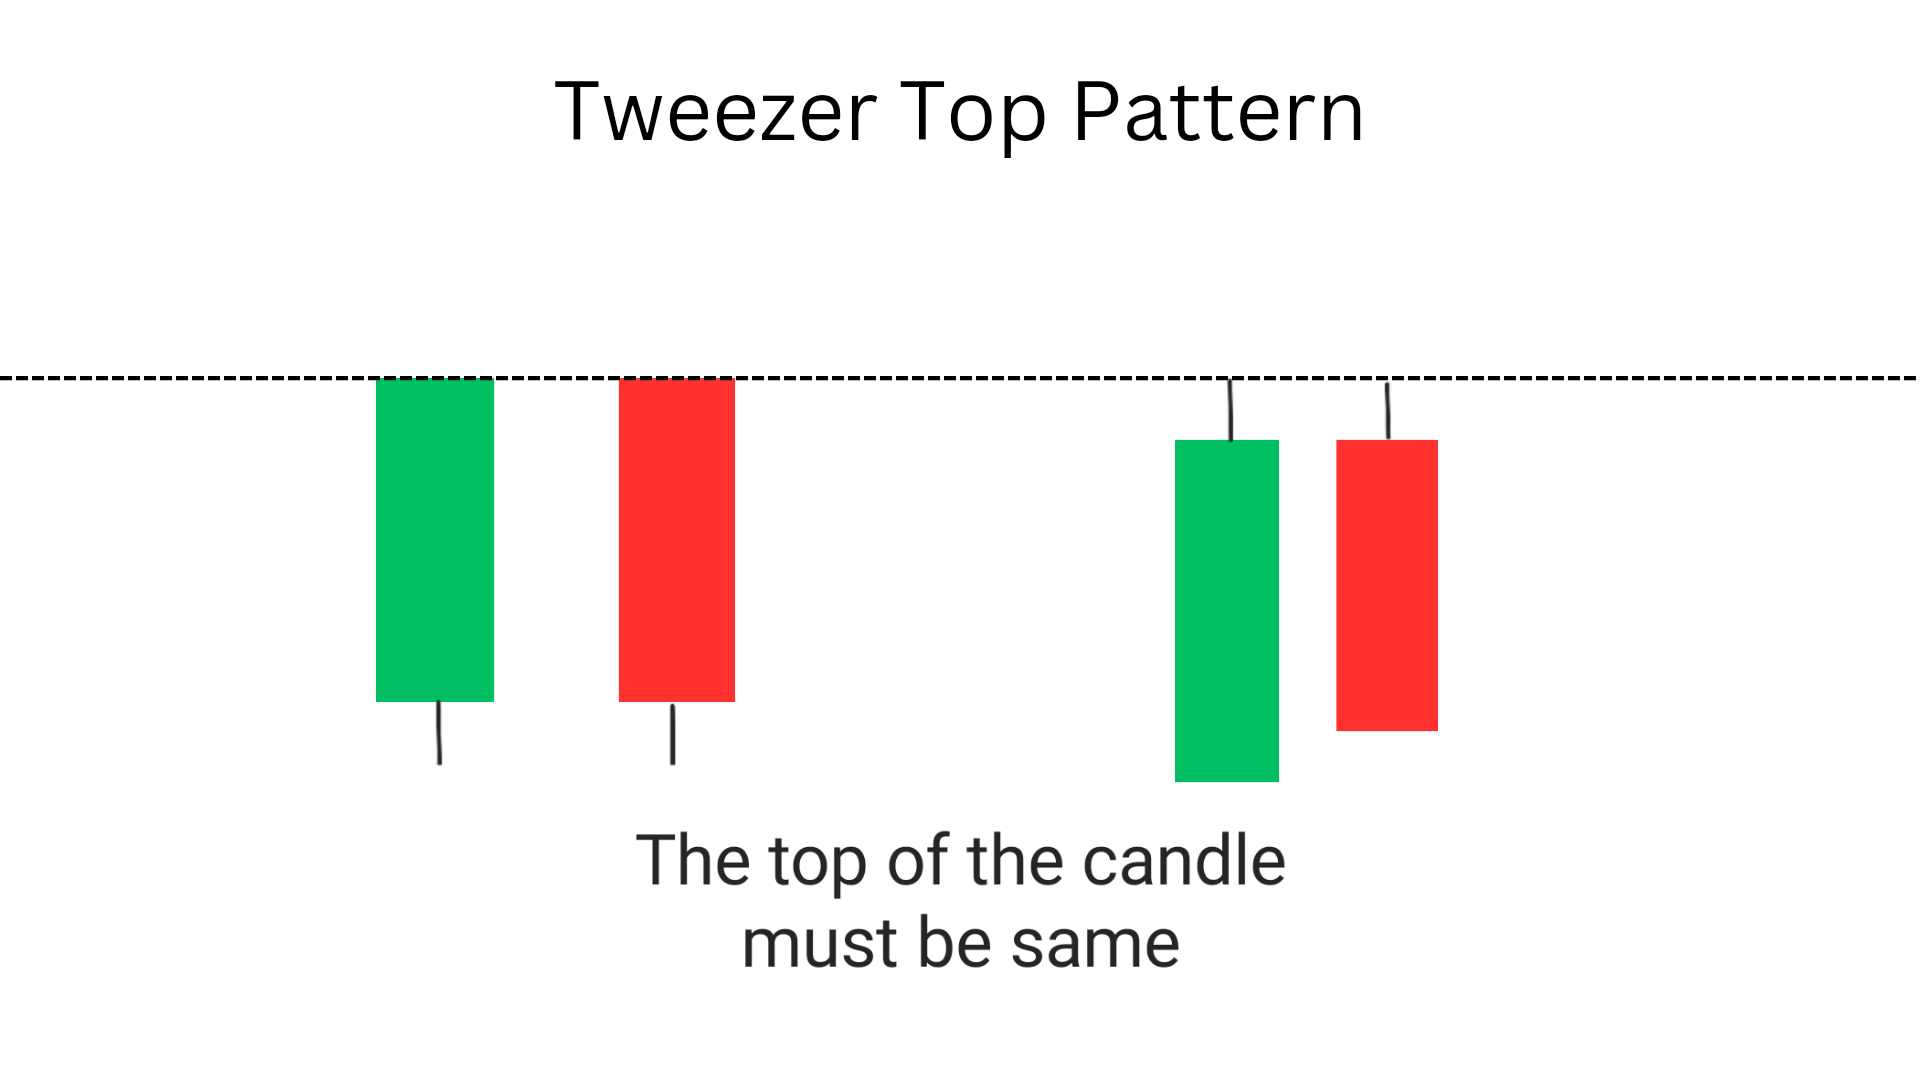
- Two or more candlesticks with the same high price.
- These candlesticks should be located at or near a resistance level.
- This pattern is formed at the top of an uptrend.
- first candle i.e bullish is formed on day 1 and the second candle i.e bearish is formed on the starting of the day 2.
Here are some key characteristics of the tweezer top pattern:
1. The first candle is bullish and second is bearish.
The first candle of tweezer top is bullish (green or white) and the second candle is bearish (red or black) both with the same high making a ‘tweezer’.
2. Two or more candlesticks with the same high price.
the most important thing that one have to notice in tweezer top pattern is that their pric high is same.
3. Located at or near a resistance level
It has the the potential yo convert uptrend into downtrend, therefore it is formed at the top of an uptrend or resistance level as from their , the chances to move price downward is high.
4. Bearish reversal pattern
The main characteristics of this pattern is that it a bearish reversal pattern, which means it has the potential to convert uptrend into downtrend.
Top Bestseller mastermind book to learn trading from scratch along with examples click here.
How to trade Tweezer Top?
The tweezer top pattern can be a powerful tool for traders looking to identify potential reversals in the market. Here are some ways to use this pattern in your trading strategy:
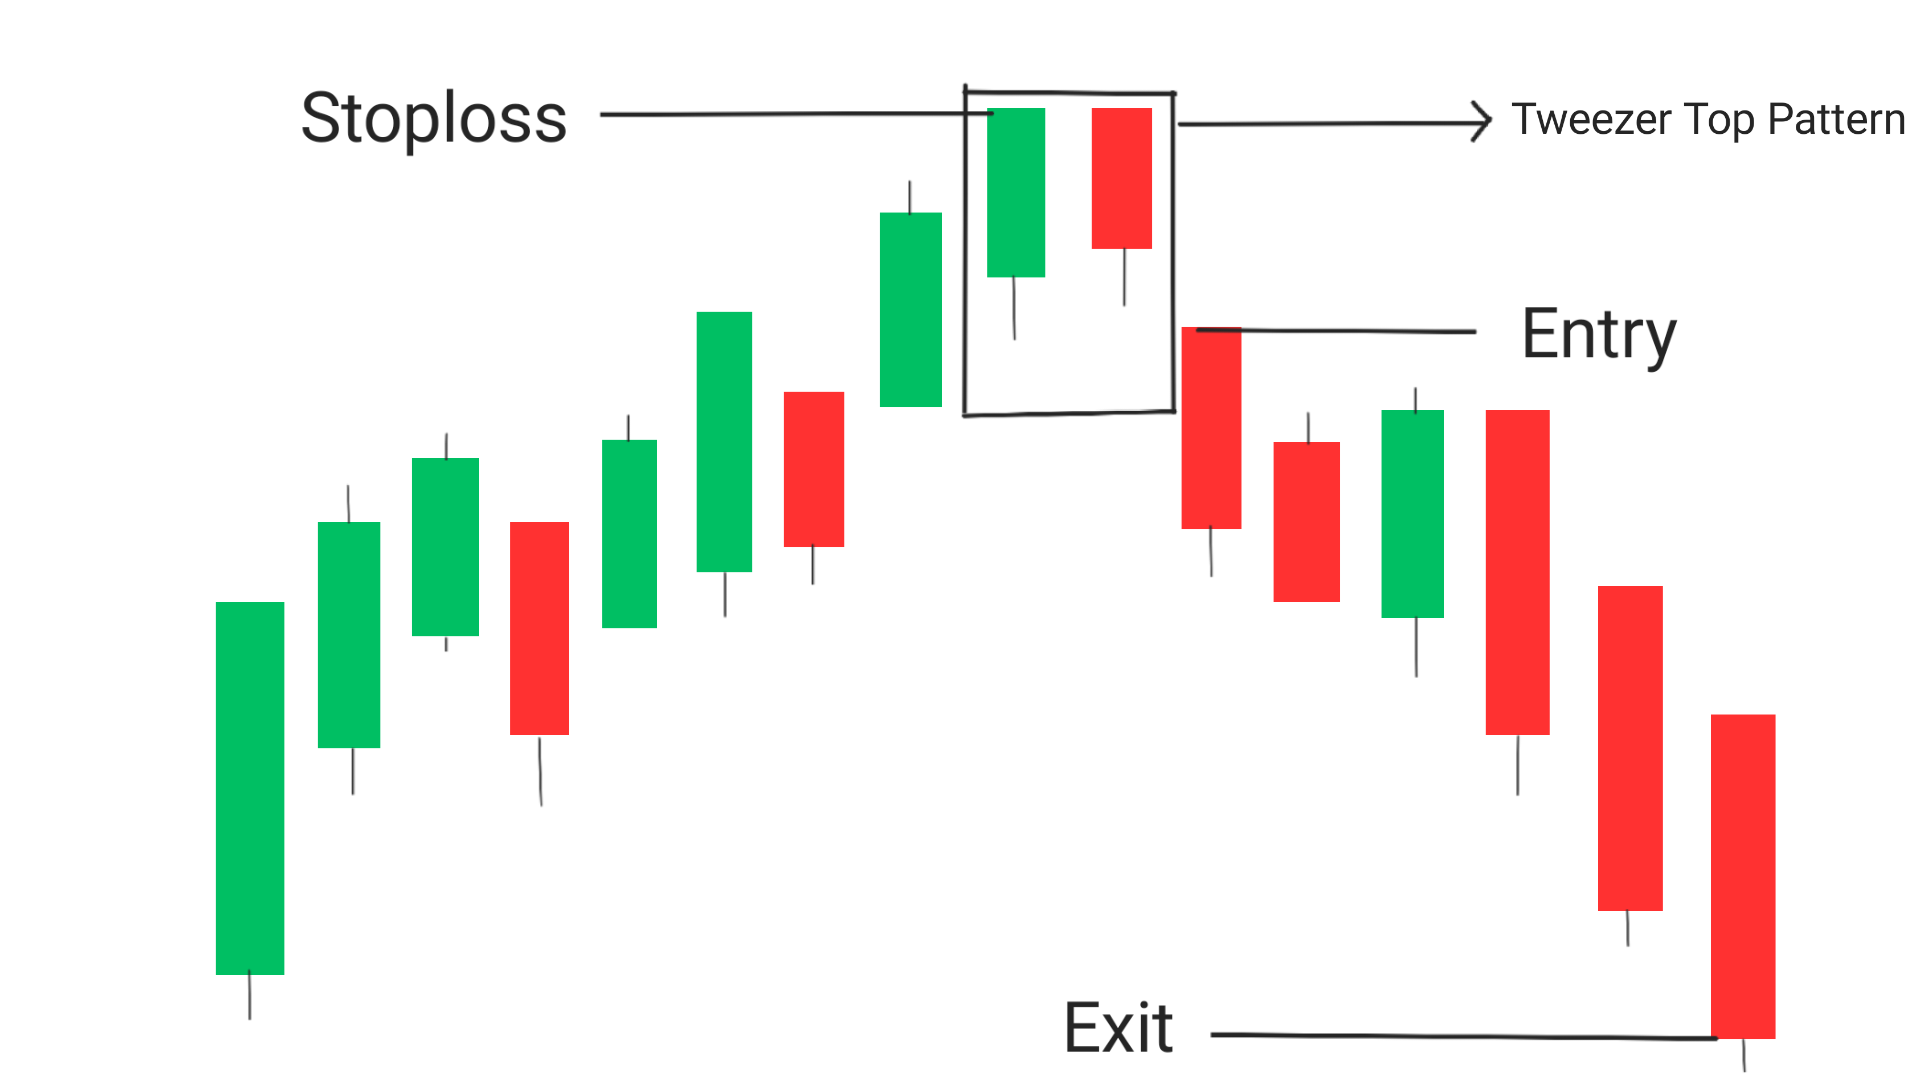
Entry: Traders can enter a short position either at the close of the second candlestick or at the open of the next candlestick.
Exit: Traders can exit the trade when the price reaches the next support level or when there is a bullish reversal signal. If you want to trade more you can look for a breakout at the support level , if that happens then take the trade for the next support level.
Stop-loss: Traders should set stop-loss levels above the resistance level to limit potential losses. A common approach is to place the stop-loss above the high of the second candlestick in the pattern.
Following are the general steps to be followed before taking any trade using tweezer top
1. Look for confirmation: Before making any trades based on the tweezer top, it’s important to look for confirmation from other indicators or chart patterns. This can help to reduce the risk of false signals and increase the accuracy of your trades.
2. Use stop-loss orders: When trading based on the tweezer top candlestick, it’s important to use stop-loss orders to limit your risk. This can help to protect your capital in case the market moves against you.
3. Combine with other indicators: The tweezer top pattern can be even more powerful when combined with other technical indicators, such as moving averages or momentum indicators. This can help to confirm the strength of the reversal signal and increase your confidence in your trades.
4. Pay attention to volume: When trading based on the tweezer top pattern, it’s important to pay attention to volume. High volume can confirm the strength of the reversal signal, while low volume can indicate that the reversal may not be as strong as it appears.
Conclusion:
The tweezer top pattern is a powerful tool for traders looking to identify potential reversals in the market. This pattern is formed when two or more candlesticks have the same high price, indicating a resistance level that the market is struggling to break through. By using this pattern in your trading strategy, you can increase your accuracy and reduce your risk, helping you to become a more successful trader. Remember to always look for confirmation, use stop-loss orders, combine with other indicators, and pay attention to volume when trading based on the tweezer top pattern.
Frequently Asked Questions (FAQs)
1.What does a tweezer top pattern mean?
A tweezer top pattern is a technical analysis candlestick pattern that occurs when two consecutive candlesticks have the same high price, but the second candlestick has a lower open and a lower close than the first candlestick. This pattern is considered a potential reversal signal when it appears at the top of an uptrend.
2.What is the formula for tweezer tops?
The formula for tweezer tops is: Two consecutive candlesticks with the same high price, followed by a lower open and a lower close on the second candlestick.
3.Is the tweezer bottom bearish or bullish?
The tweezer bottom pattern is bullish, as it can indicate a potential reversal of a downtrend.
4.What is the success rate of tweezers top?
The success rate of tweezer top is around 60% , which means for every 10 trades taken you can make profit in 6 out of them. It also varies depending on market conditions and other factors, but it is generally considered to be a reliable reversal signal when combined with other technical indicators and analysis.
5.What are the three types of tweezers?
The three types of tweezers are:
- regular tweezer tops/bottoms
- long-legged doji tweezer tops/bottoms
- dragonfly doji tweezer tops/bottoms.
6. What is a tweezer top pattern?
A tweezer top pattern is a bearish reversal pattern that consists of two or more candlesticks with the same high price located at or near a resistance level, with long upper shadows.
7. How does a tweezer top pattern form?
A tweezer top pattern forms when the market attempts to push prices higher, but fails to do so and ends up creating two or more candlesticks with the same high price.
8. What is the significance of a tweezer top pattern?
A tweezer top pattern is significant because it indicates that the market may be losing bullish momentum and that a trend reversal may be imminent.
9. How can traders use a tweezer top pattern in their trading strategy?
Traders can use a tweezer top pattern as a signal to enter short positions or to exit long positions. They can also use it as a confirmation of other technical indicators or chart patterns.
10. Are there any limitations to the effectiveness of a tweezer top pattern?
Yes, like all technical indicators and chart patterns, a tweezer top pattern is not 100% correct.