Bullish harami Candlestick Pattern

In the field of trading and investing, there are various candlestick patters and technical analysis tools and indicators that traders use to make informed decisions. One such tool is the bullish harami candlestick pattern. in this blog we go through all the aspects of his candlestick pattern this article will include a to z everything about bullish harami candlestick pattern.
What is a Bullish Harami candlestick pattern?
The bullish harami is a two candlestick bullish reversal pattern that indicates a potential reversal in a downtrend. The pattern consists of a large bearish candle followed by a smaller bullish candle, where the body of the second candle is completely engulfed within the body of the first candle. This formation suggests a possible shift in momentum from bearish to bullish, as the smaller bullish candle suggests that buying pressure may be starting to outweigh selling pressure.
How does bullish harami candlestick pattern looks?
This pattern is generally formed at the bottom of a downtrend, so if we want to see its appearance in practical then first look for a downtrend. This pattern is formed over a two day period.
following are the characteristics of bullish harami:-
1. The first candle has a long and the second candle has a small body.
2. The first is bearish (red) and the second candle is bullish(green).
3. The first candle ( red candle ) completely engulfs the second candle(green candle)
Significance of of this pattern on chart
When the this pattern appears at the end of a downtrend, it is considered a bullish signal. It suggests that the sellers are losing control and buyers may start to push the price higher. This can be an opportune time for traders to consider entering long positions or closing out short positions, as the pattern indicates a potential shift in market sentiment.
learn all candlestick pattern at one place, buy best guide to learn trading from this link.
How to trade using bullish harami candlestick pattern?
Traders can utilize the bullish harami pattern as part of their technical analysis strategy to identify potential buying opportunities. When spotting this pattern on a price chart, traders can look for confirmation signals such as an increase in trading volume or additional bullish candlestick patterns to strengthen their conviction in a potential trend reversal. Additionally, traders may consider using other technical indicators such as moving averages or oscillators to further validate the bullish signal provided by the harami pattern.
Trading using a bullish harami candlestick pattern involves identifying a potential trend reversal from bearish to bullish. Here’s a step-by-step guide on how to trade using this pattern:

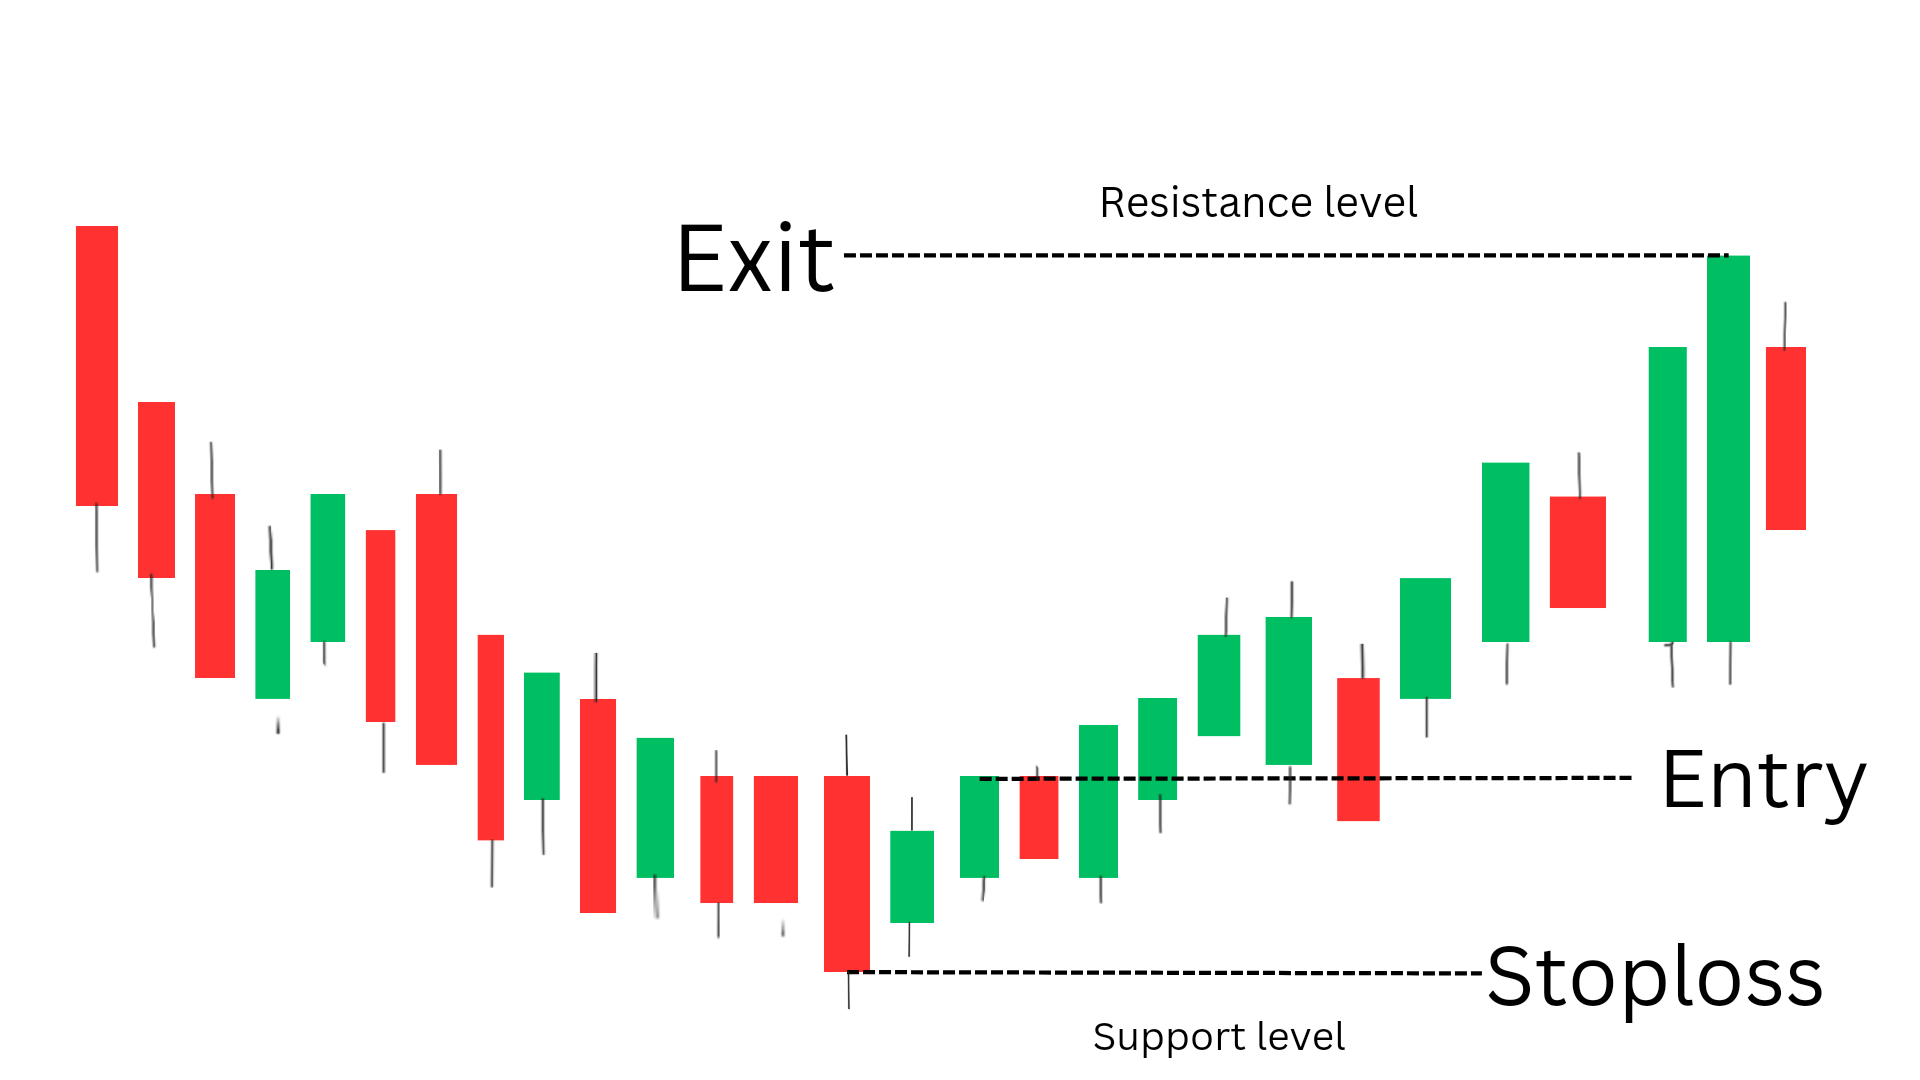
Entry:-
1. The first step is to Identify a downtrend in the market.
2. After finding a downtrend,look for a long bearish candlestick followed by a short bullish candlestick that is completely engulfed within the body of the previous bearish candlestick. This forms the bullish harami pattern.
3. Enter a long position at the open of the next candle after the bullish harami pattern.
Exit:-
1. Take profits when the price reaches a significant resistance level or when the trend starts to show signs of weakening.
2. Alternatively, use a trailing stop-loss to lock in profits as the price continues to move in your favor.
Stop loss:-
1. Place a stop-loss order below the low of the bullish harami pattern to protect against potential losses if the trend does not reverse as expected.
Confirmation with other indicators:
1. Use technical indicators such as the moving average convergence divergence (MACD) or the relative strength index (RSI) to confirm the strength of the potential trend reversal indicated by the bullish harami pattern.
2. Look for bullish divergence on the RSI or a bullish crossover on the MACD to confirm the trade.
It’s important to note that no trading strategy is 100% correct, and it’s essential to practice proper risk management and use additional technical analysis tools to confirm potential trade setups. Additionally, traders must consider market conditions and news events that could impact their trades.
This pattern in Different Timeframes:
It’s important to note that the significance of this pattern may vary depending on different timeframe in which it appears. For instance, a bullish harami on a daily chart may indicate a potential short-term reversal, while the same pattern on a weekly chart could signal a longer-term trend reversal.
Traders should consider the context and timeframe in which the pattern appears to make well-informed trading decisions.
In conclusion, the bullish harami candlestick pattern is a valuable tool for traders to identify potential trend reversals in the market. By understanding the significance of this pattern and using it along with other technical analysis tools, traders can gain insights into potential buying opportunities and make informed trading decisions. It’s important to remember that no single indicator or pattern guarantees success in trading, but incorporating the bullish harami into a comprehensive trading strategy can help improve decision-making and increase the likelihood of profitable trades.
Frequently Asked Questions
1.Is bullish harami reliable?
Yes, the bullish harami is considered to be a reliable bullish reversal pattern in technical analysis. It has apotential of converting downtrend into uptrend.
2.What is the psychology behind bullish harami?
The psychology behind the bullish harami is that after a downtrend, sellers become exhausted leading to a period of indecision and consolidation before a potential reversal in sentiment and price direction. This signals that buyers are ready to step in, and can reverse the momentum.
3.What is the entry in the bullish harami pattern?
The entry in the bullish harami pattern occurs when the second candle closes higher than the first candle’s close, signaling a potential shift in momentum to the upside.
4.What is the best bullish pattern?
The best bullish pattern is subjective and depends on the specific market conditions, but some commonly recognized ones include the double bottom, ascending triangle, and cup and handle patterns.
5.What is the success rate of the bullish harami?
The success rate of the bullish harami pattern is around 50% , for every two trade you will be definitely successful in one trade, but it is generally considered to have a moderate to high success rate when used in conjunction with other technical indicators and analysis